 en español
Self Organizing Maps
UnioviSOM
UnioviSOM is a Matlab toolbox, that we have released as open-source, under the GNU General Public License. You can download it in the following page
UnioviSOM pageDemoSOM. Interactive SOM interface prototype
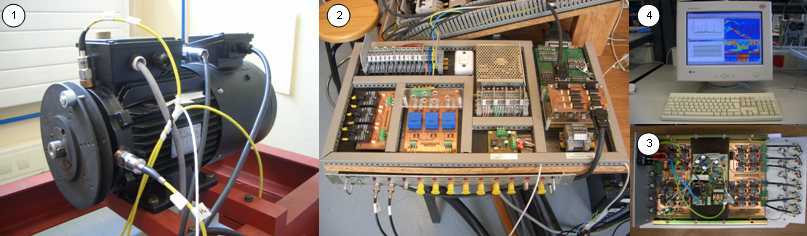
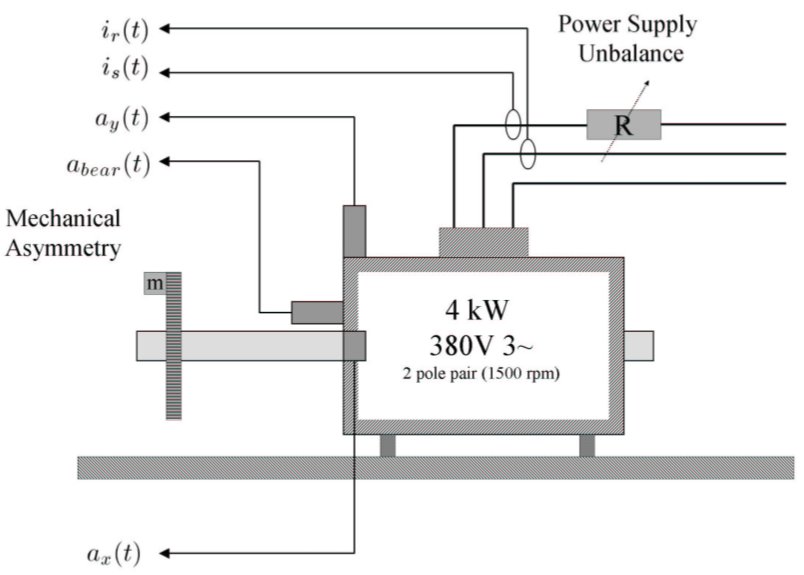
This page describes a prototype of interface for SOM visualization with interaction elements such as brush, coordinated views, labeling, hover, etc. The interface shows real data from a 4kW / 1500 rpm induction motor, under several degrees of electrical imbalance (asymmetric load in phase R) and mechanical (mass eccenctricity w.r.t. the rotation axis), as shown in the figure below:
Test rig
SOM planes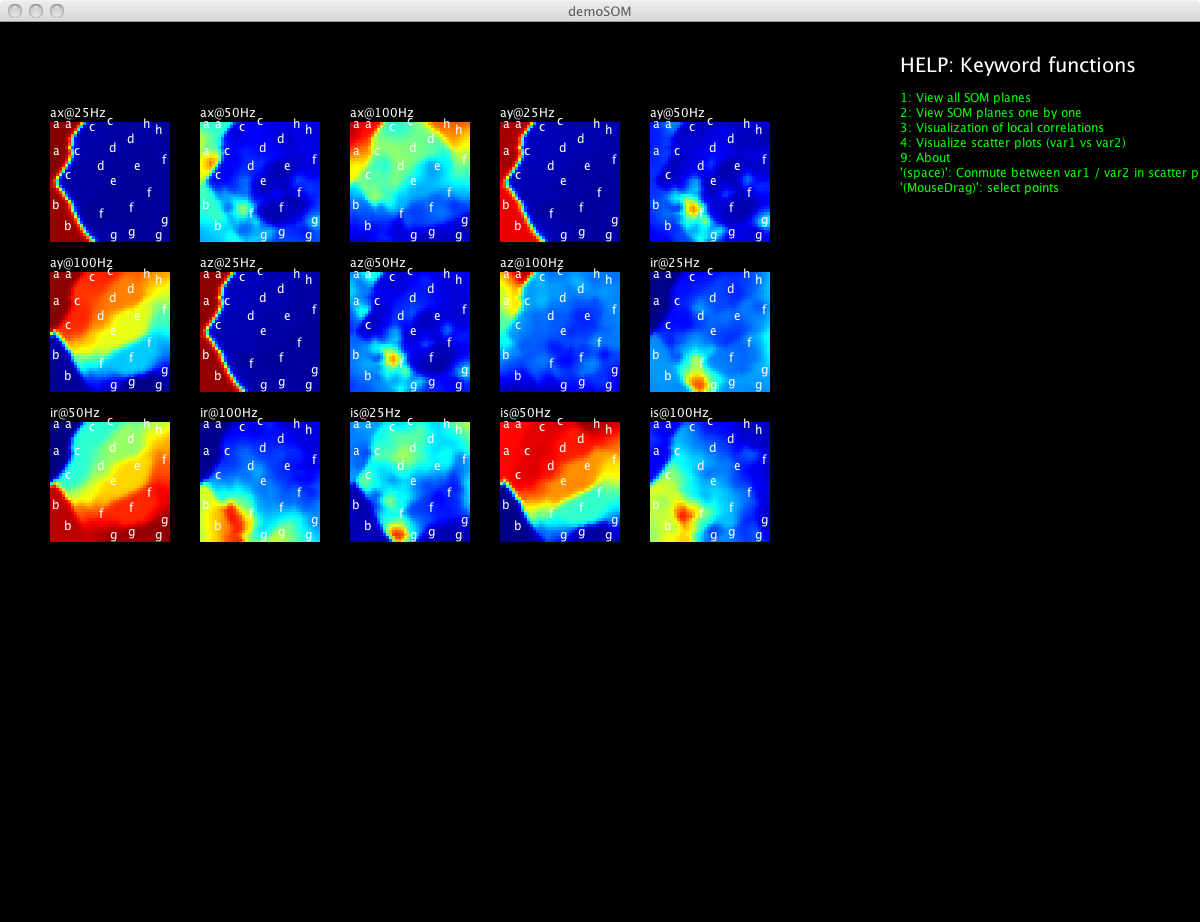 Provide a global view of the variables, showing the main states of the motor, as well as allowing to detect the main relationships among the variables. | SOM planes + timeplots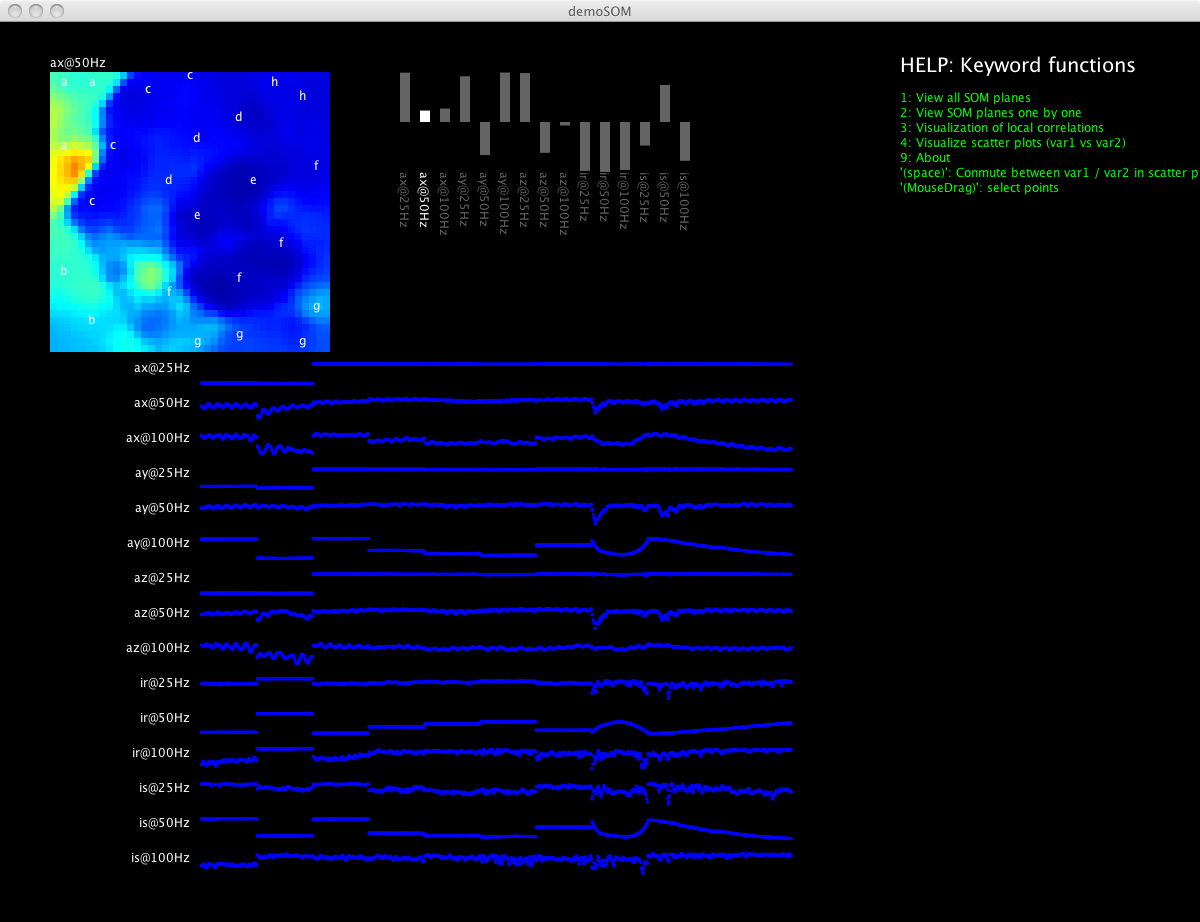 Simultaneous visualization of time plots and SOM planes. The user can select ranges in time and see the location of the corresponding states in the SOM planes. Conversely, the user can select (brush) regions in the SOM planes and observe their locations in the time plots. |
Local correlations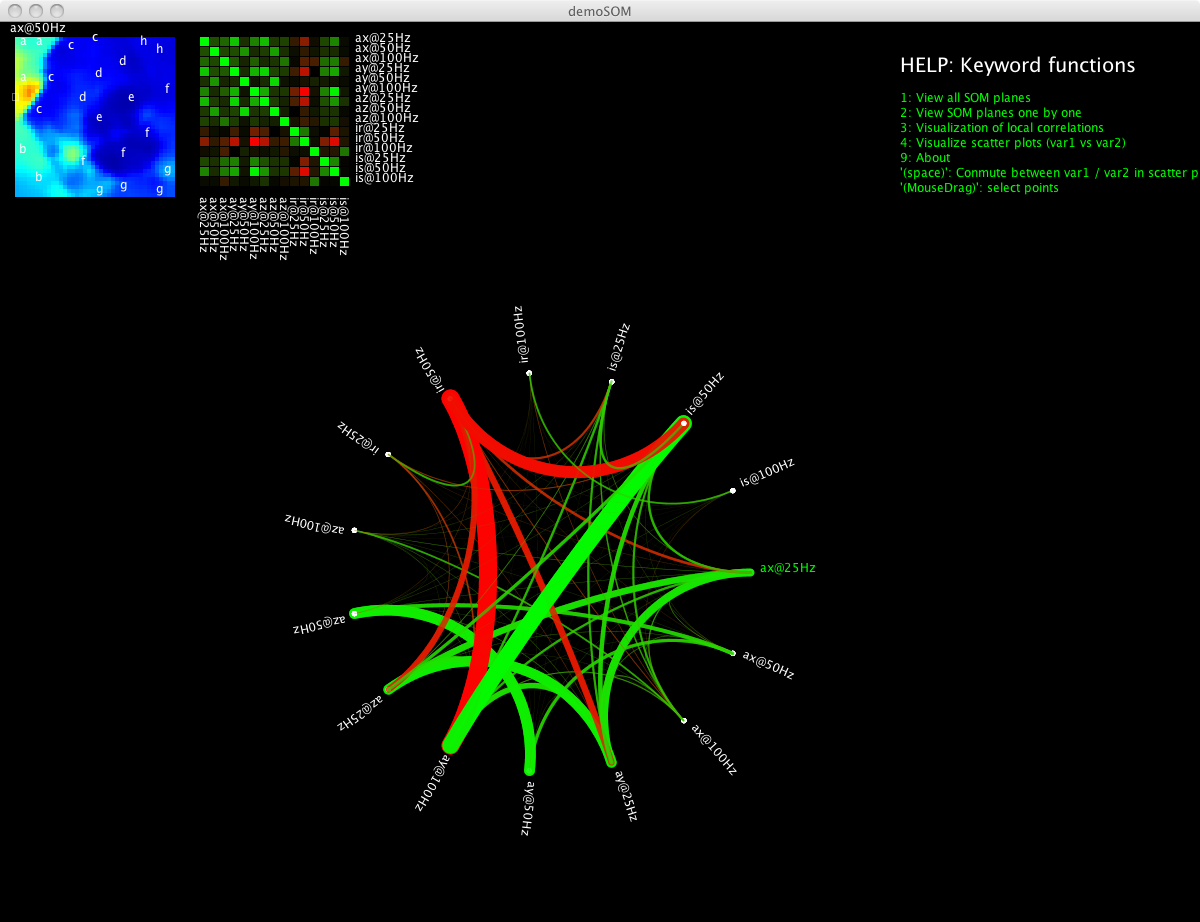 The interface, features some visual encodings such as the local correlation matrix as well as an equivalent representation using an arc diagram showing connections between variables. The local correlations, that depend on the working point, change as the user moves the mouse on the SOM. |
Scatterplots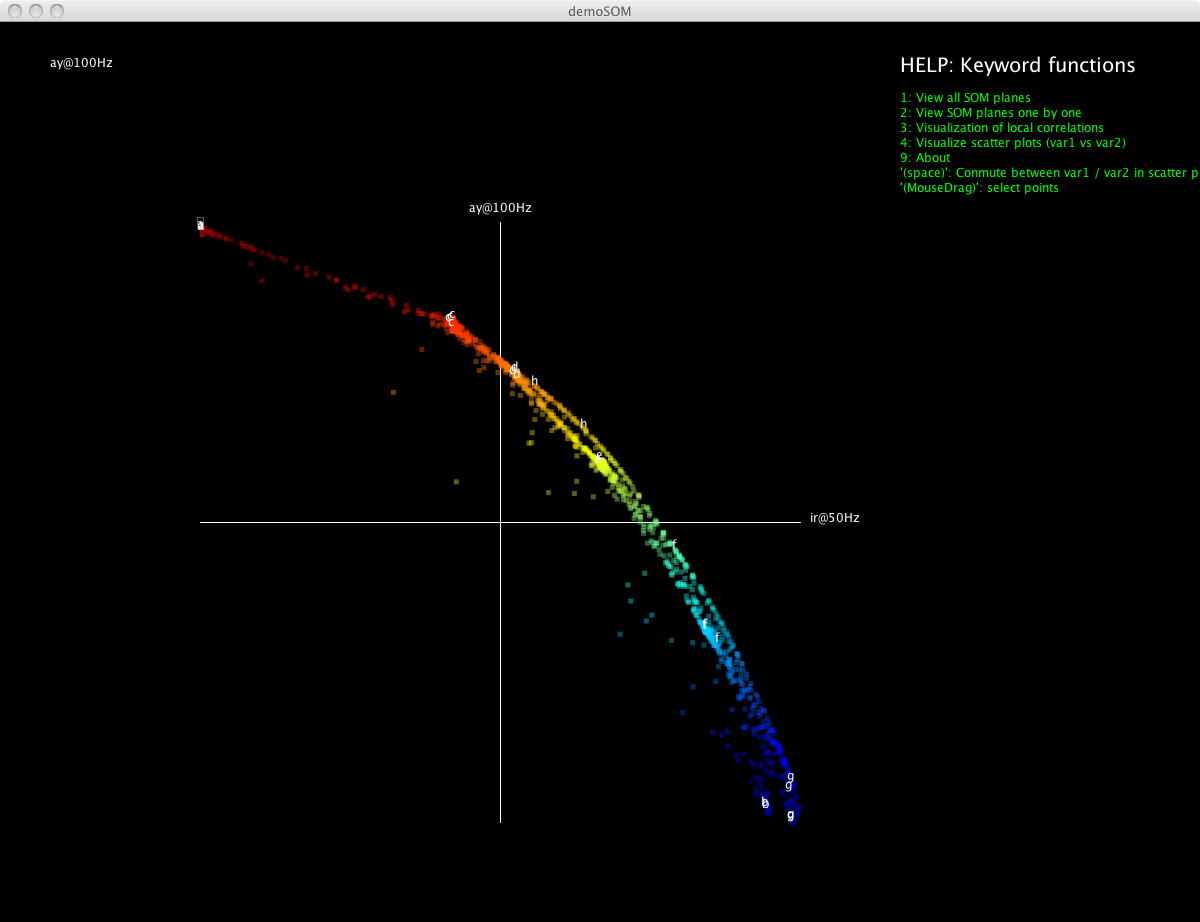 The interface can display the codebook vectors of the SOM by means of scatter plots in pairs of variables. The user can select many points by means of a brush gesture, so that when changing to another view, his selection is kept and the selected points are displayed with the new arrangement. The interface, also allows to add text labels that are also preserved between views. |
In the next link you can try the interactive SOM demo
Note: due to web security problems of hava in last years, you need to ad isa.uniovi.es to the trusted sites in the configuration. You can follow the next steps:
- Java control panel
- Security
- List of site exceptions
- edit the site liste
- add to the list http://isa.uniovi.es
Basic help of the demo
            "1": View of the SOM planes
            "2": View of the SOM planes (one by one) along with the time plots.
            "3": Local correlations view
            "4": Codebook scatter plot view
            "9": About... ("Acerca de ...")
    "(espacio)": commute between var1 / var2
 "(mouse drag)": select points (applicable in the planes, timeplots and scatter plots)
            "0": delete the selection
javascript version
If you can't run the applet, you can test the application with the javascript version below (it will run slightly slower).