|
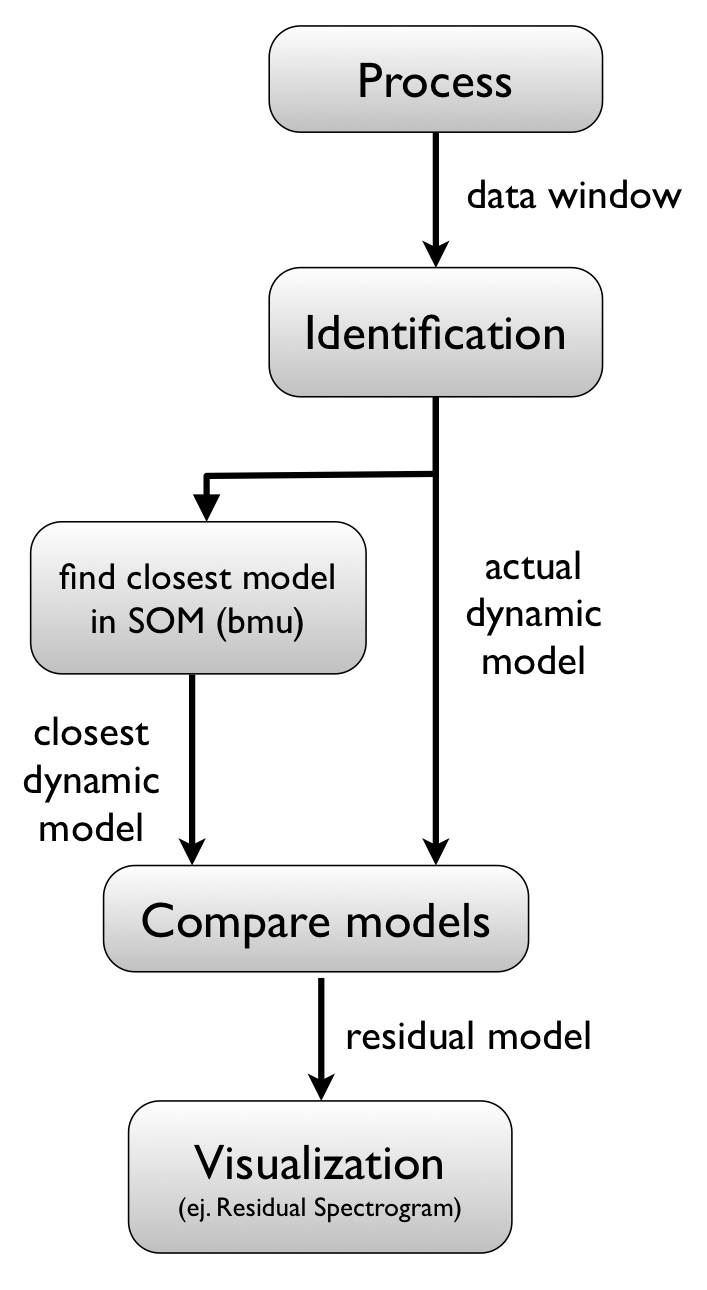
One interesting posibility in the field of novelty detection is the detection of changes in the dynamic behavior. The GSDPI has been working on an extension of the idea of analytic redundancy using the SOM of dynamic local models, proposing a visualization procedure that uses a local model SOM previously trained to identify process dynamics under normal (no fault) operation. This can be achieved in three stages:
- Estimate a dynamic model of the current process dynamical behavior, using recent process data -a basic parametric model ARX(p,q) can be used, for instance.
- Retrieve the closest local dynamic model of the SOM (i.e. the best matching model) using a proper disimilarity measure to compare the current model and the SOM models.
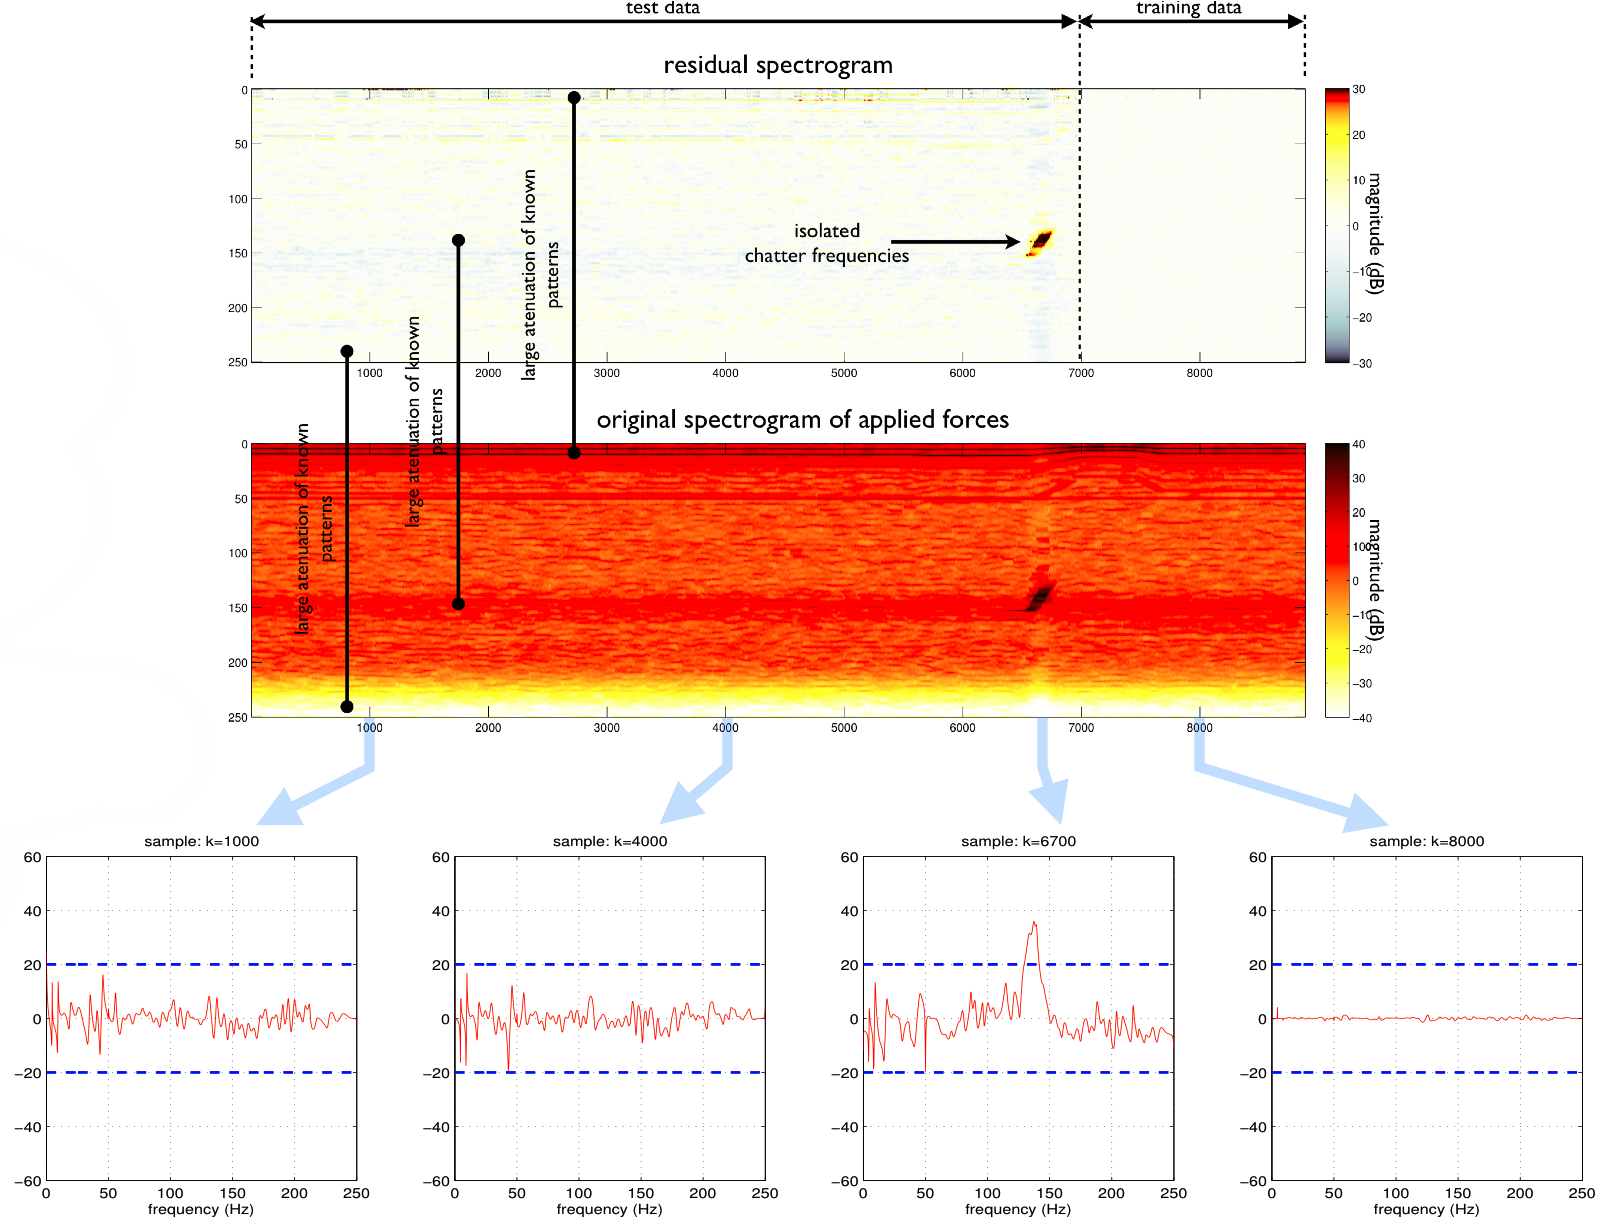
- Compute the differences between both models. For instance, the difference between logarighmic frequency responses (Bode magnitudes) could be done, resulting in a residual frequency response. These residual frequency responses could be further represented along time, resulting in a spectrogram-like visualization showing a time-frequency evolution of the dynamic differences.
|  |
 en español
