Interactive dimensionality reduction (iDR)
DR algorithms in visual analytics
| Dimensionality reduction (DR) algorithms are able to find latent low dimensional structures hidden in high dimensional data, allowing to obtain a mapping onto a low dimensional space (typically 2D or 3D, for visualization) that preserves the most significant underlying structure in data. | 
|
| DR algorithms are based in computing the mutual distances between the elements of a high dimensional input space, to obtain a representation on a low dimensional visualization space (2D/3D) that preserves the underlying structure of data defined by these mutual distances. In other words, DR algorithms define a mapping or projection from the high dimensional input space onto a low dimensional visualization space that preserves the most significant structure and topological relationships of the data in the original space. DR algorithms are very useful tools for visual analytics, since they provide an advanced form of data "spatialization", that is, they allow to generate visual representations whereby the spatial proximity between two elements \(i\) and \(j\) in the visualization, represent the similarity between elements \(\mathbf x_i\) and \(\mathbf x_j\) in the high dimensional input space. | |
Interactive DR algorithms (iDR)
A key element in visual analytics is interaction. Interaction techniques, such as zoom zoom, translation and rotation of data, focus & context, brushing, etc., allow the user to reconfigure the visualization to focus on interesting aspects of data or to discard irrelevant information. In the typical workflow of DR application for data visualization, interaction often takes place after DR computation of projections. The user typically sets an initial configuration for the DR algorithm, runs it until convergence and, after N iterations, the results are visualized. The user can then use interaction techniques to reconfigure this visualization or even decide to run the DR algorithm again with a different parameterization, therby starting the cycle again.
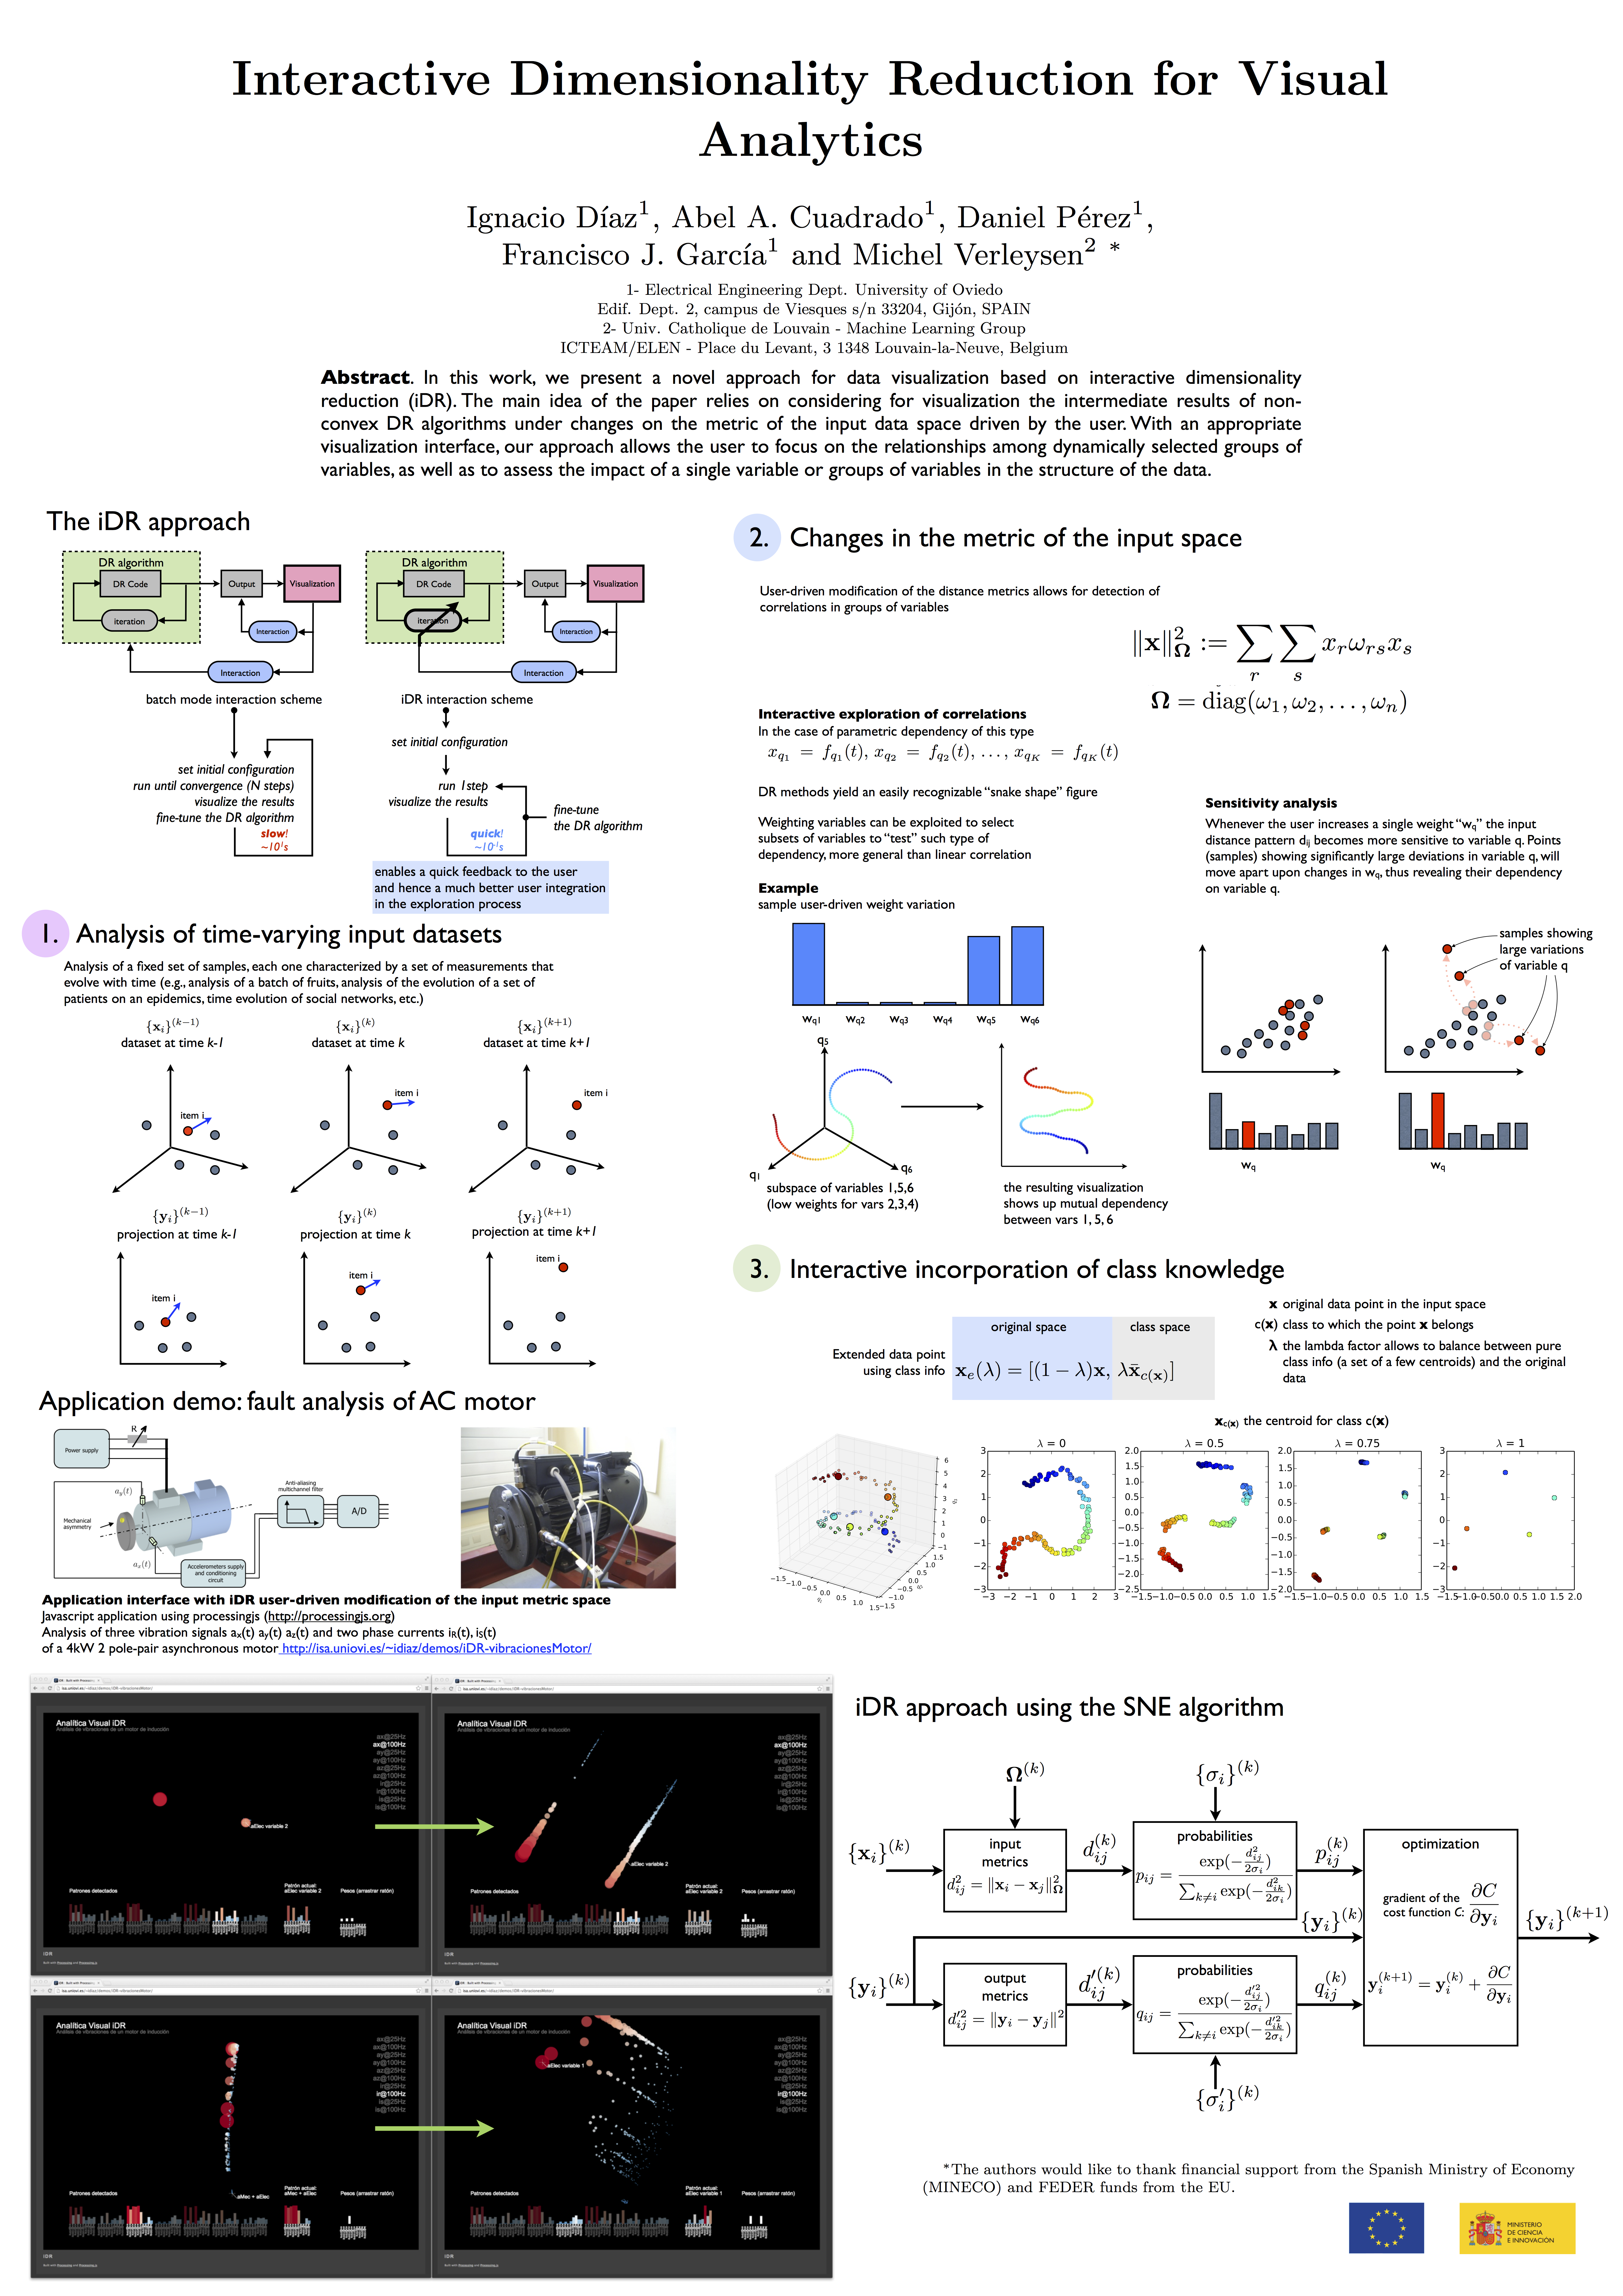
However, interaction can go far beyond this approach if we allow the user to take complete control of the DR algorithm during convergence, and visualize the intermediante results. Using non-convex algorithms, such as the SNE (stochastic neighbor embedding), that are based on an iterative approximation mechanism, the visualization of intermediate results describes a smoothly changing structure that reveals in a dynamic way the changes in the relationships between the samples in terms of the chosen parameters (e.g. redefining the weights of the variables to define similarities).
The result is a visualization that changes dynamically -an animated transition- that allows the user to track the changes in the projection that results from changes in the formulation of the problem, such as changes in the metrics of the input space (e.g. through user-defined modifications of weights in the input variables), or time varying input data (e.g. dynamical processes where the input data vectors vary with time).
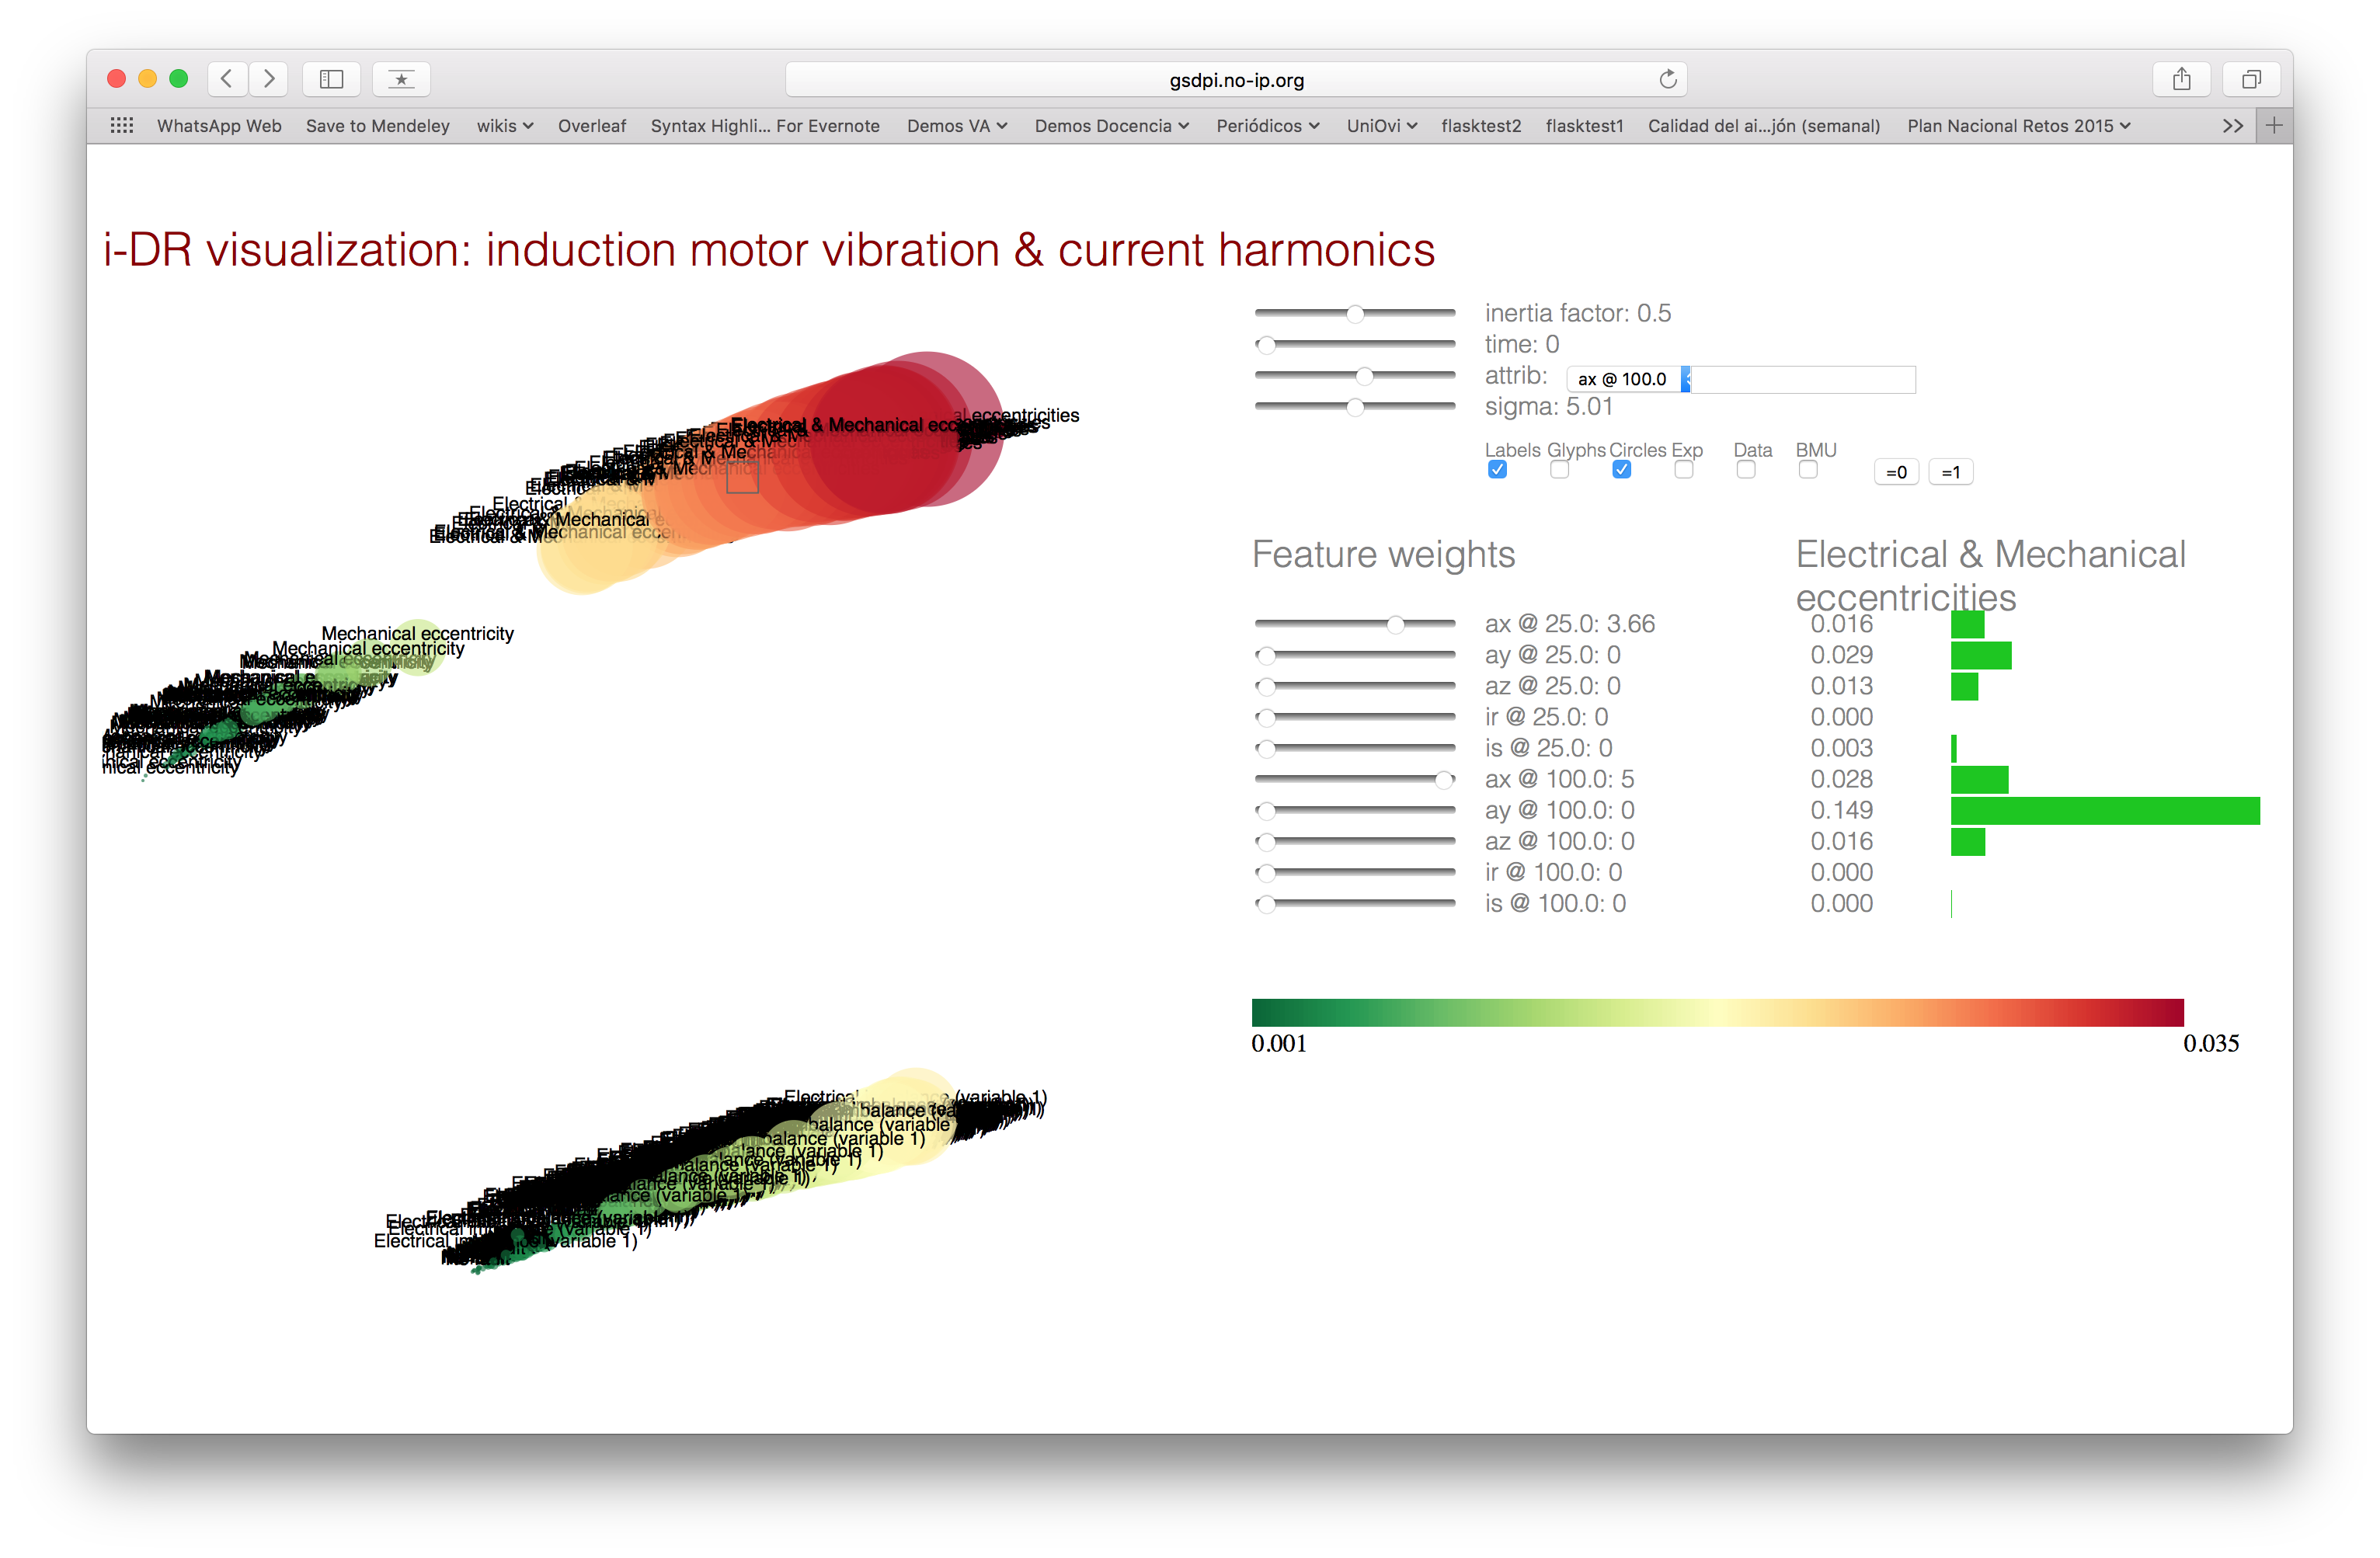
Application to the interactive visualization of vibration states on an induction rotating machine
References
- Ignacio Díaz, Abel A. Cuadrado, Daniel Pérez, Francisco J. García, and Michel Verleysen "Interactive Dimensionality Reduction for Visual Analytics". In European Symposium on Artificial Neural Networks, Computational Intelligence and Machine Learning, Bruges, Belgium. April, 2014. (descargar pdf)
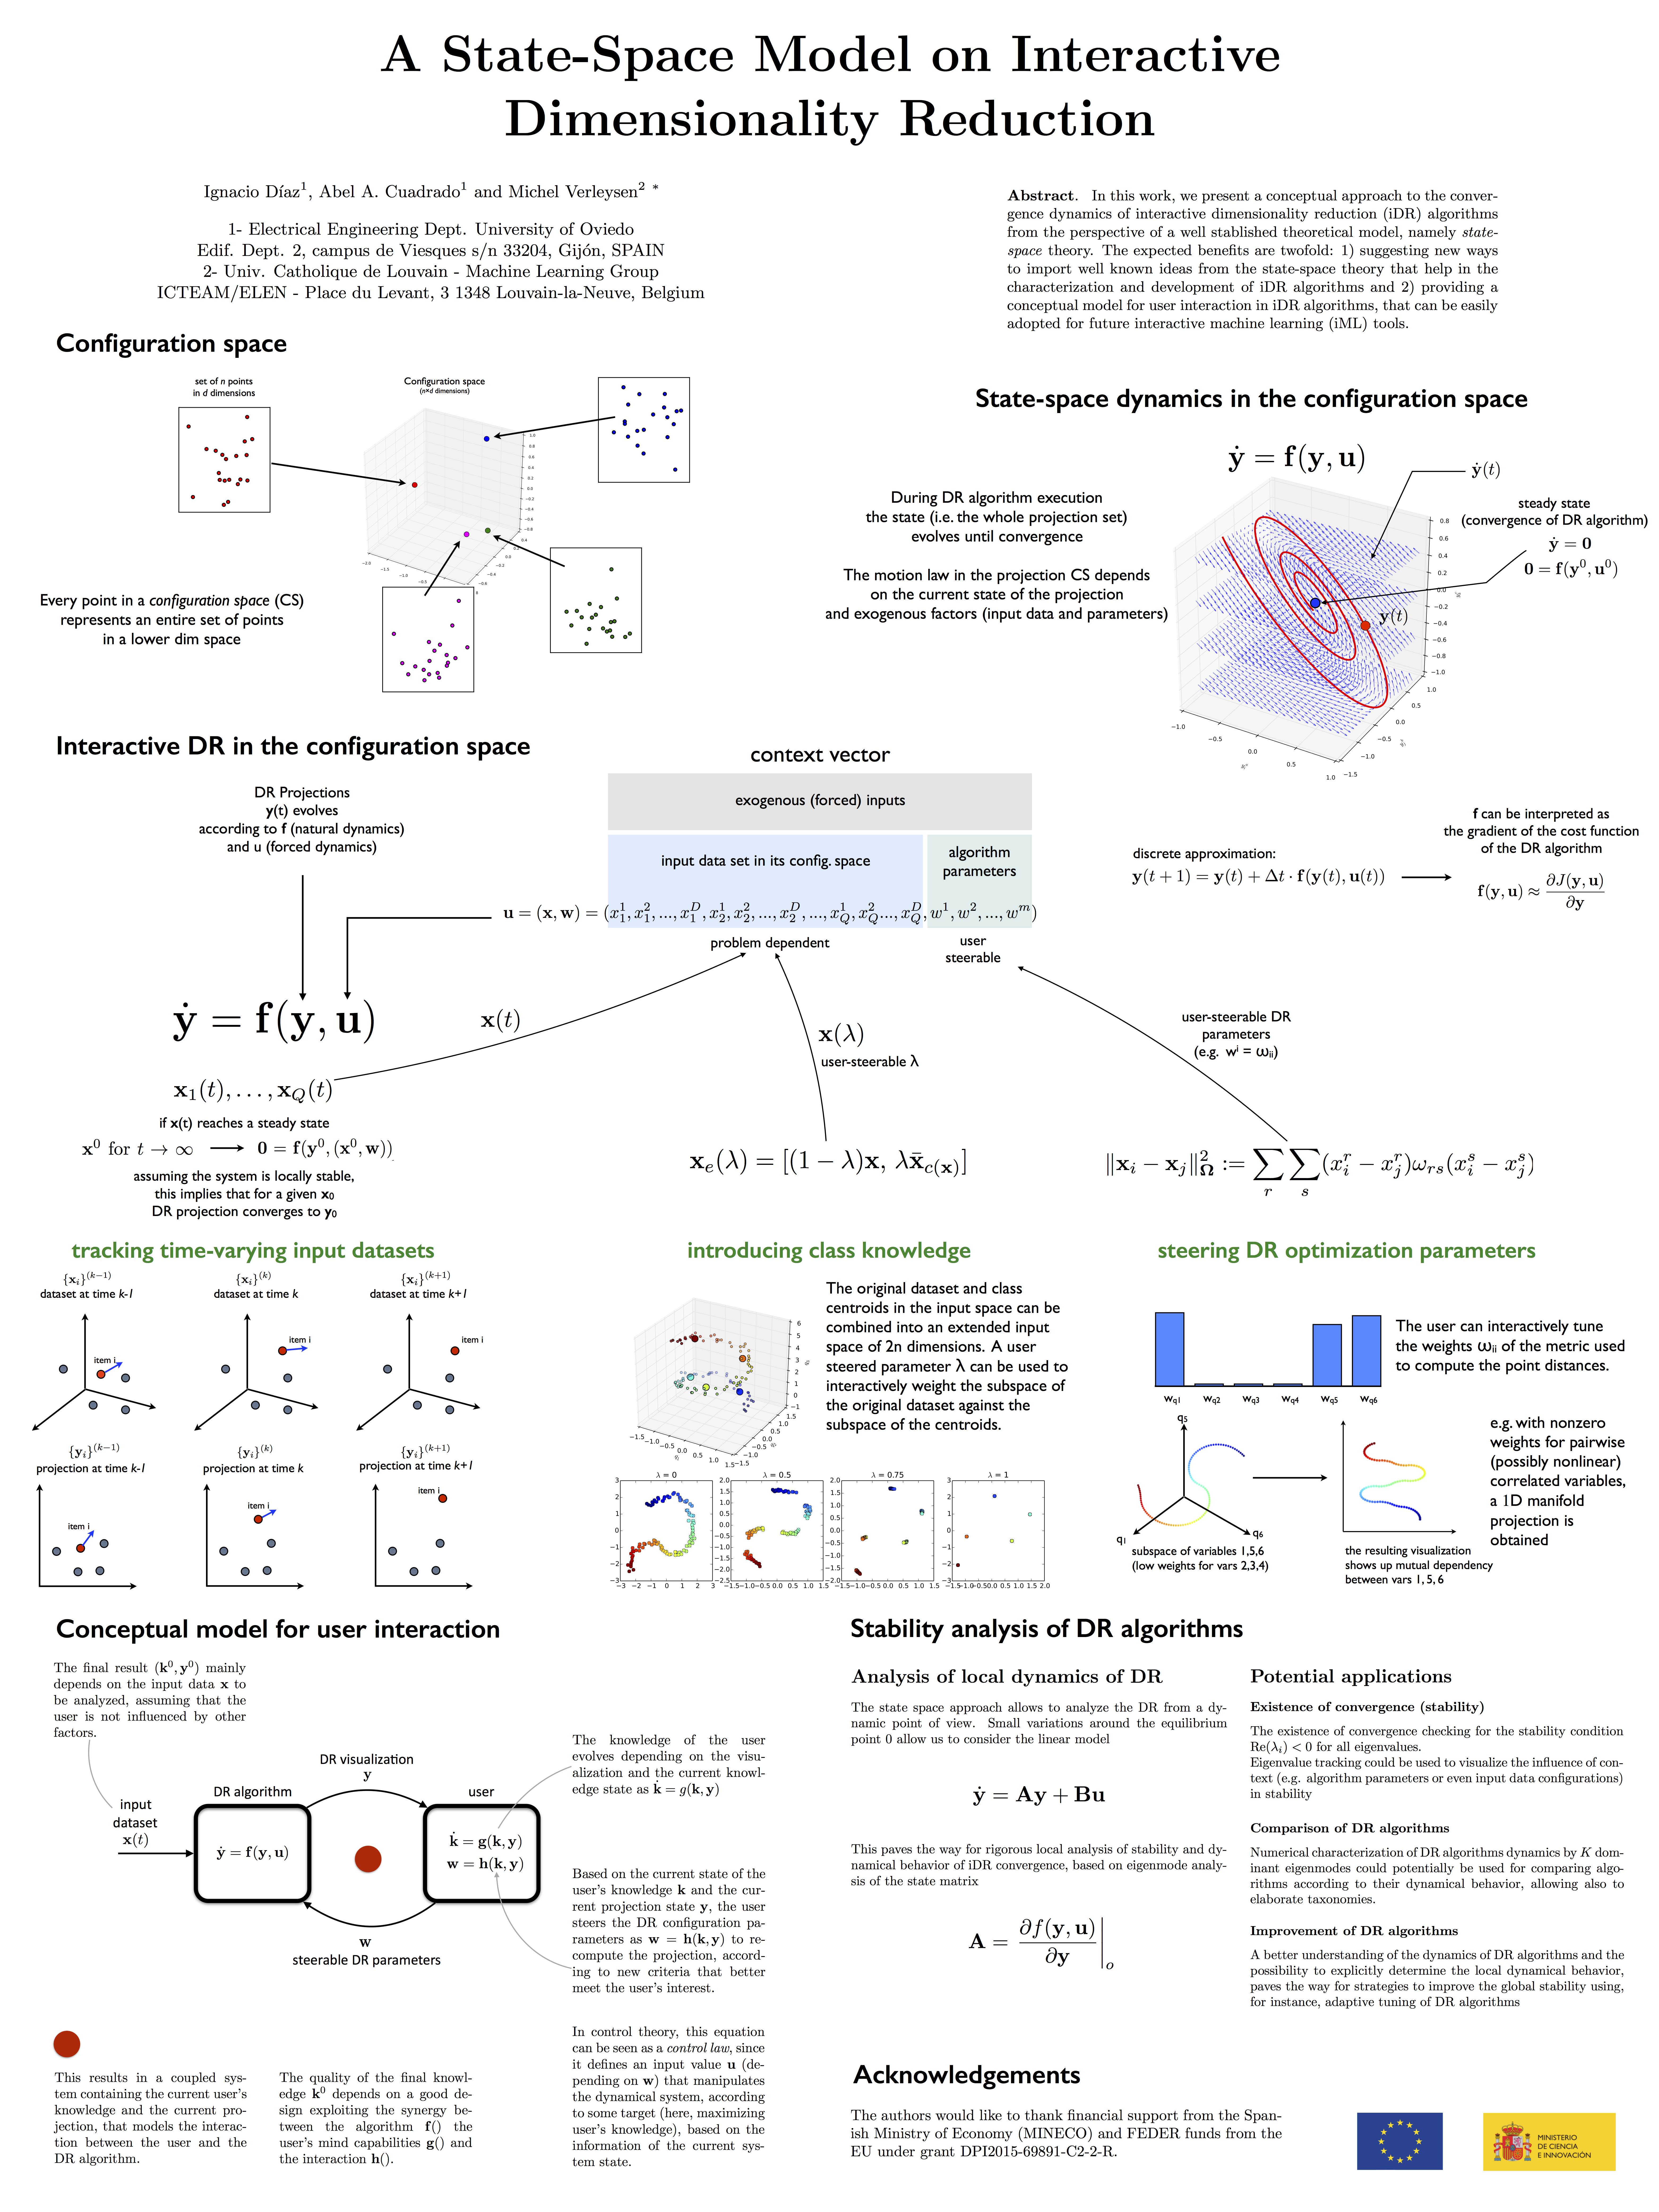
- Ignacio Díaz Blanco, Abel A. Cuadrado, and Michel Verleysen "A State-Space Model on Interactive Dimensionality Reduction". In European Symposium on Artificial Neural Networks, Computational Intelligence and Machine Learning, Bruges, Belgium. pp. 647-652. April, 2016. [→ pdf][→ pdf poster][→ pdf spotlight]
Acknowledgements
| The research published in this page has been financed by funds of the Principado de Asturias, from the Ministry of Economy and Competitivity (mineco) and by FEDER funds from the European Union under project grants DPI2009-13398-C02/01 and DPI2015-69891-C2-2-R |  |
 en español

