 en español
Gallery
|
Morphing projections 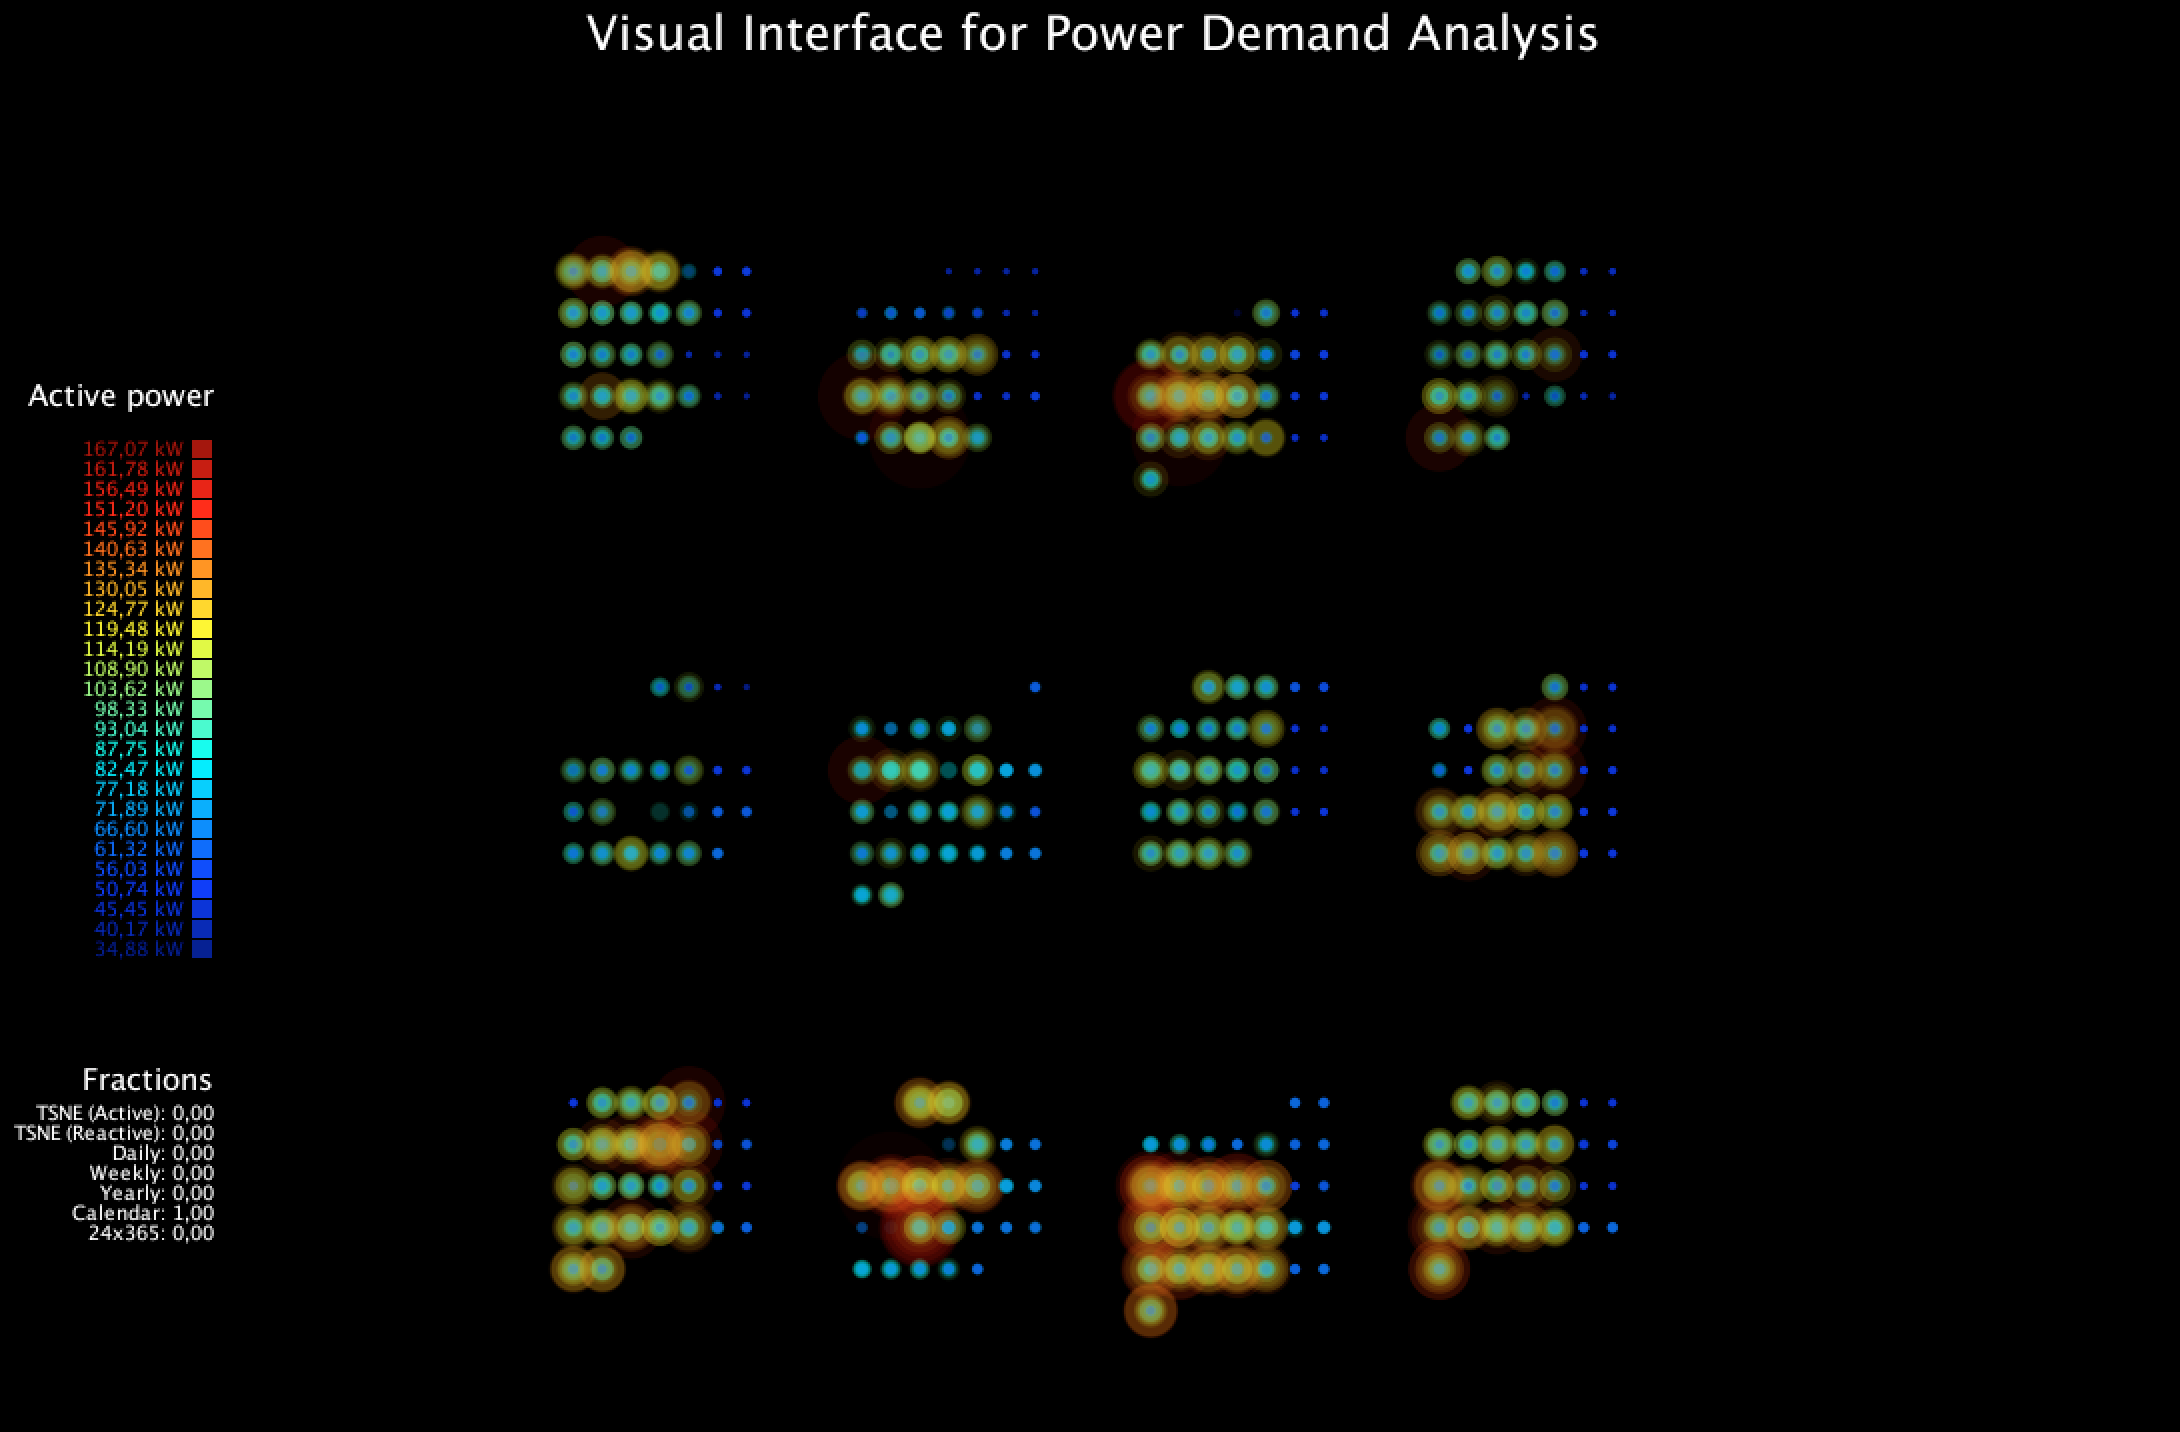 |
Interactive dimensionality reduction (iDR) 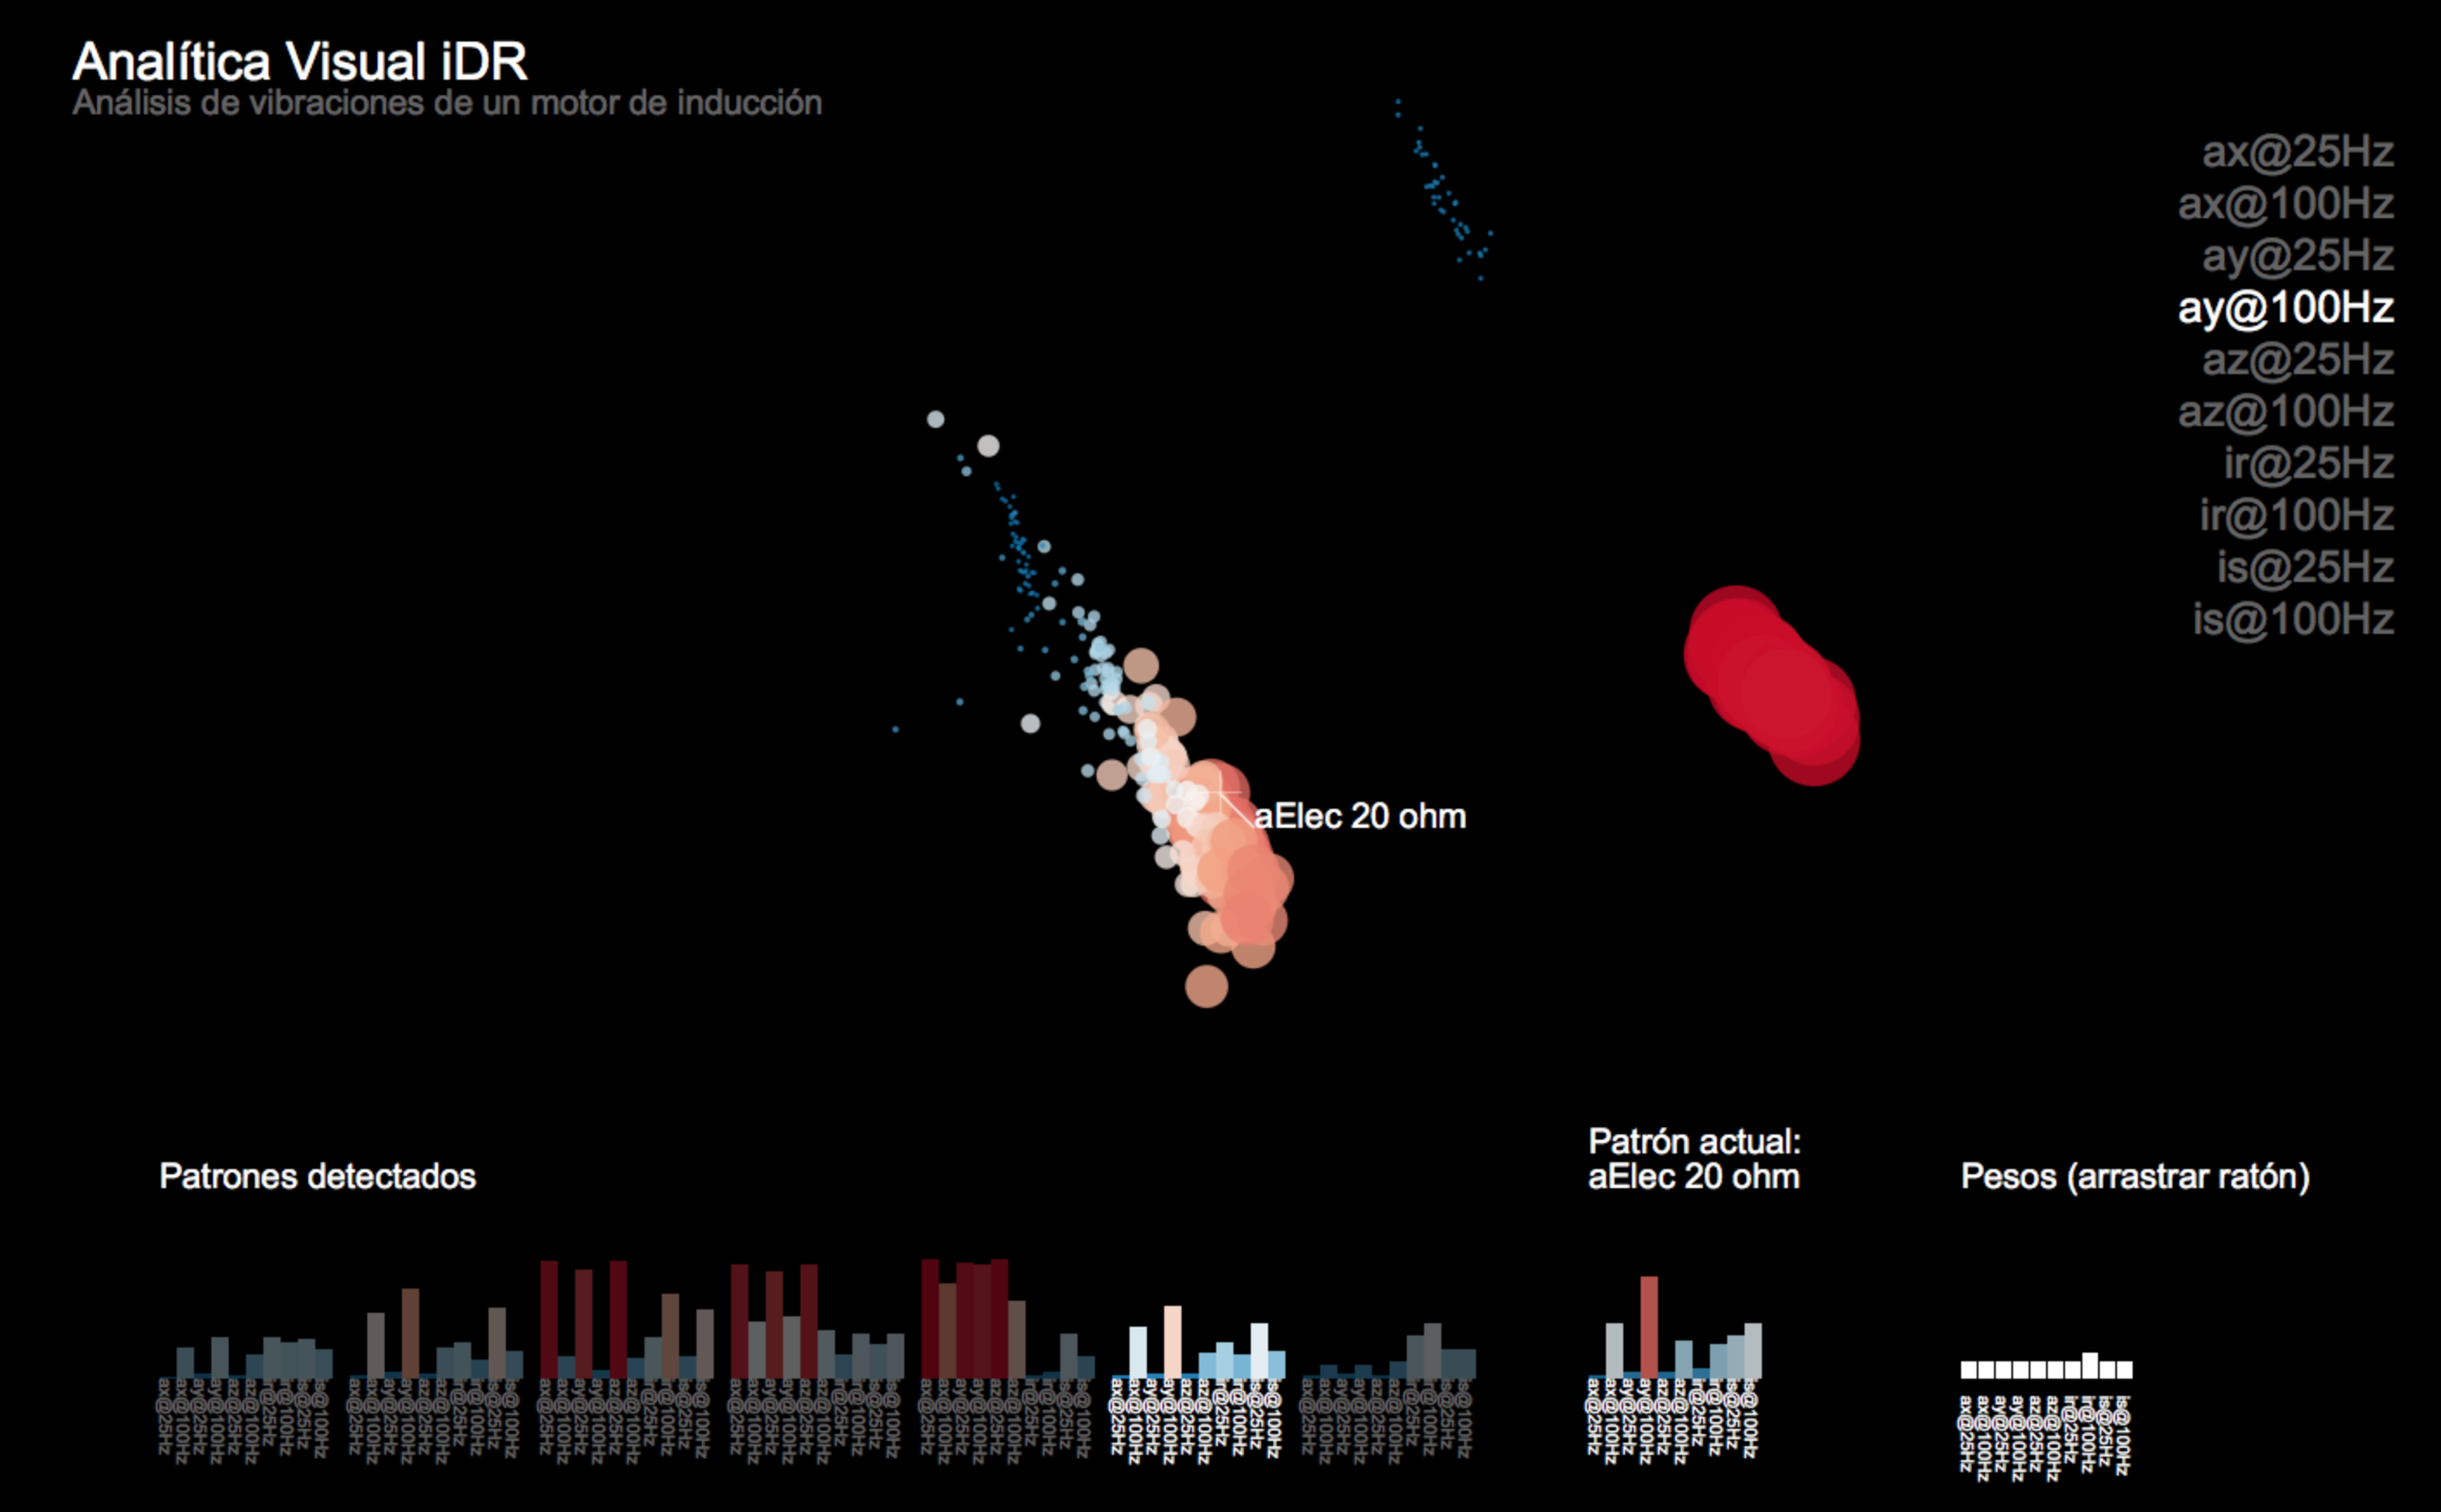 |
Radial visualization 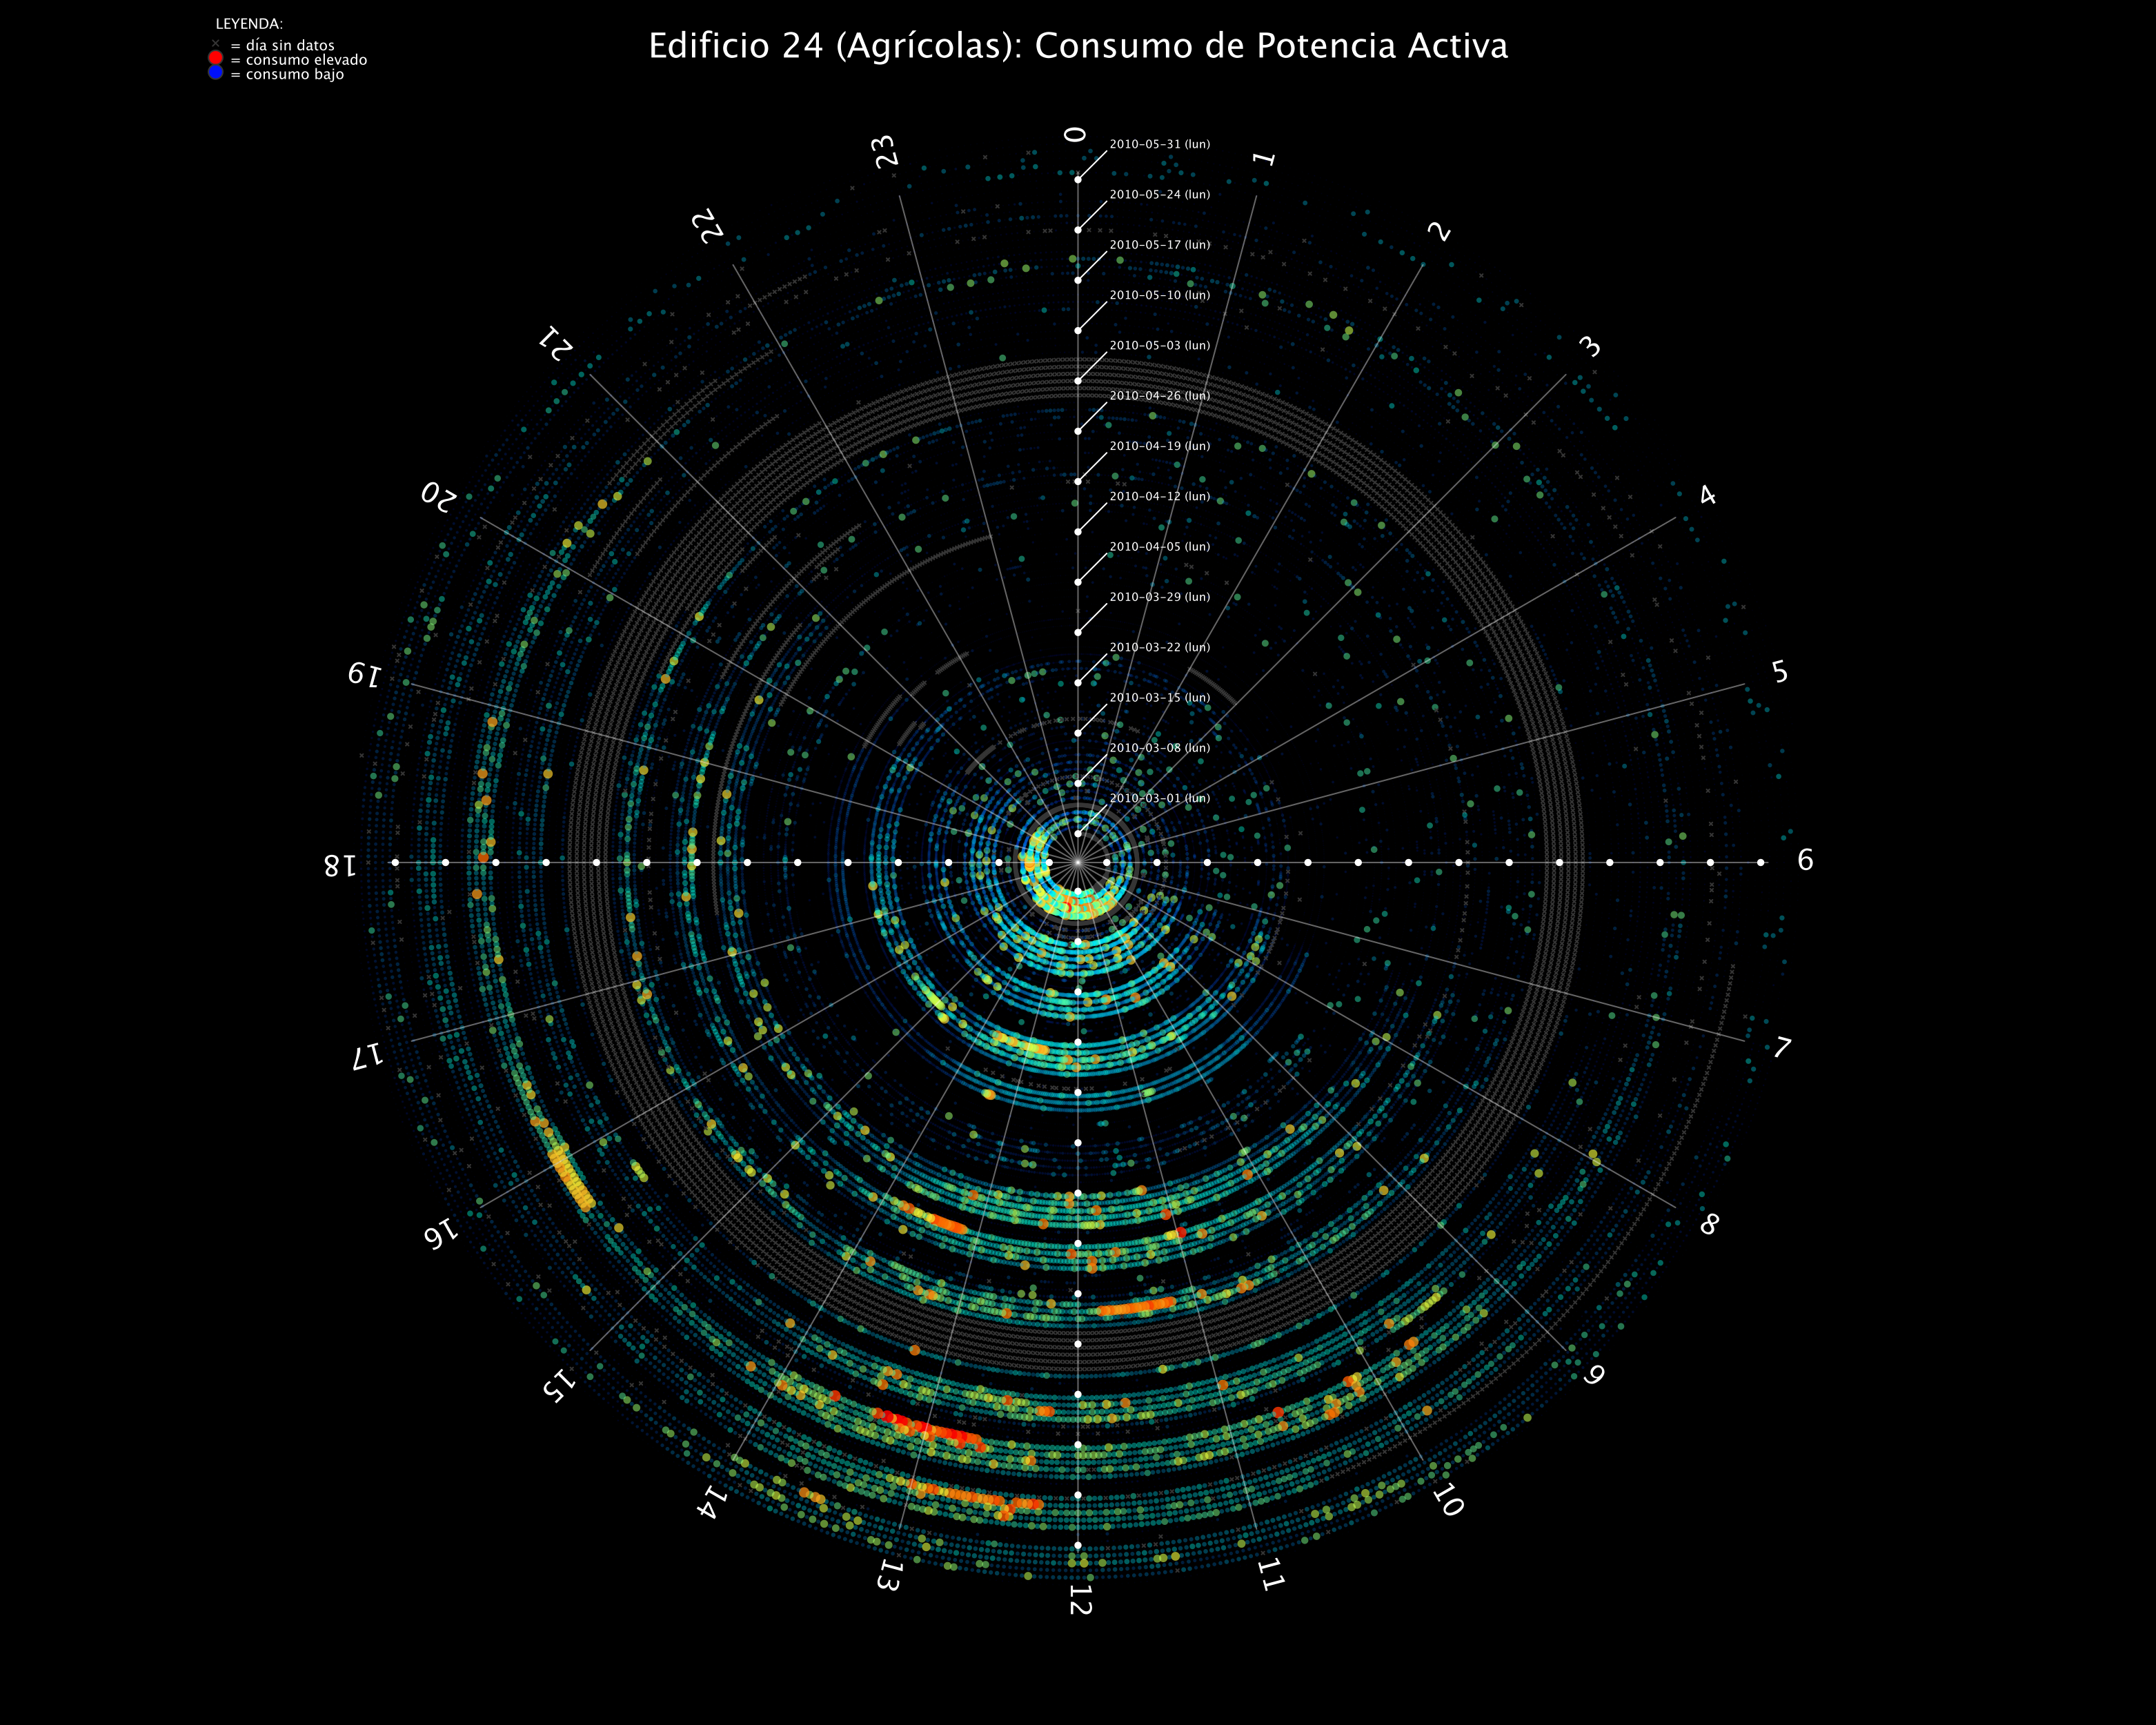
|
|---|---|---|
|
Maps of dynamics 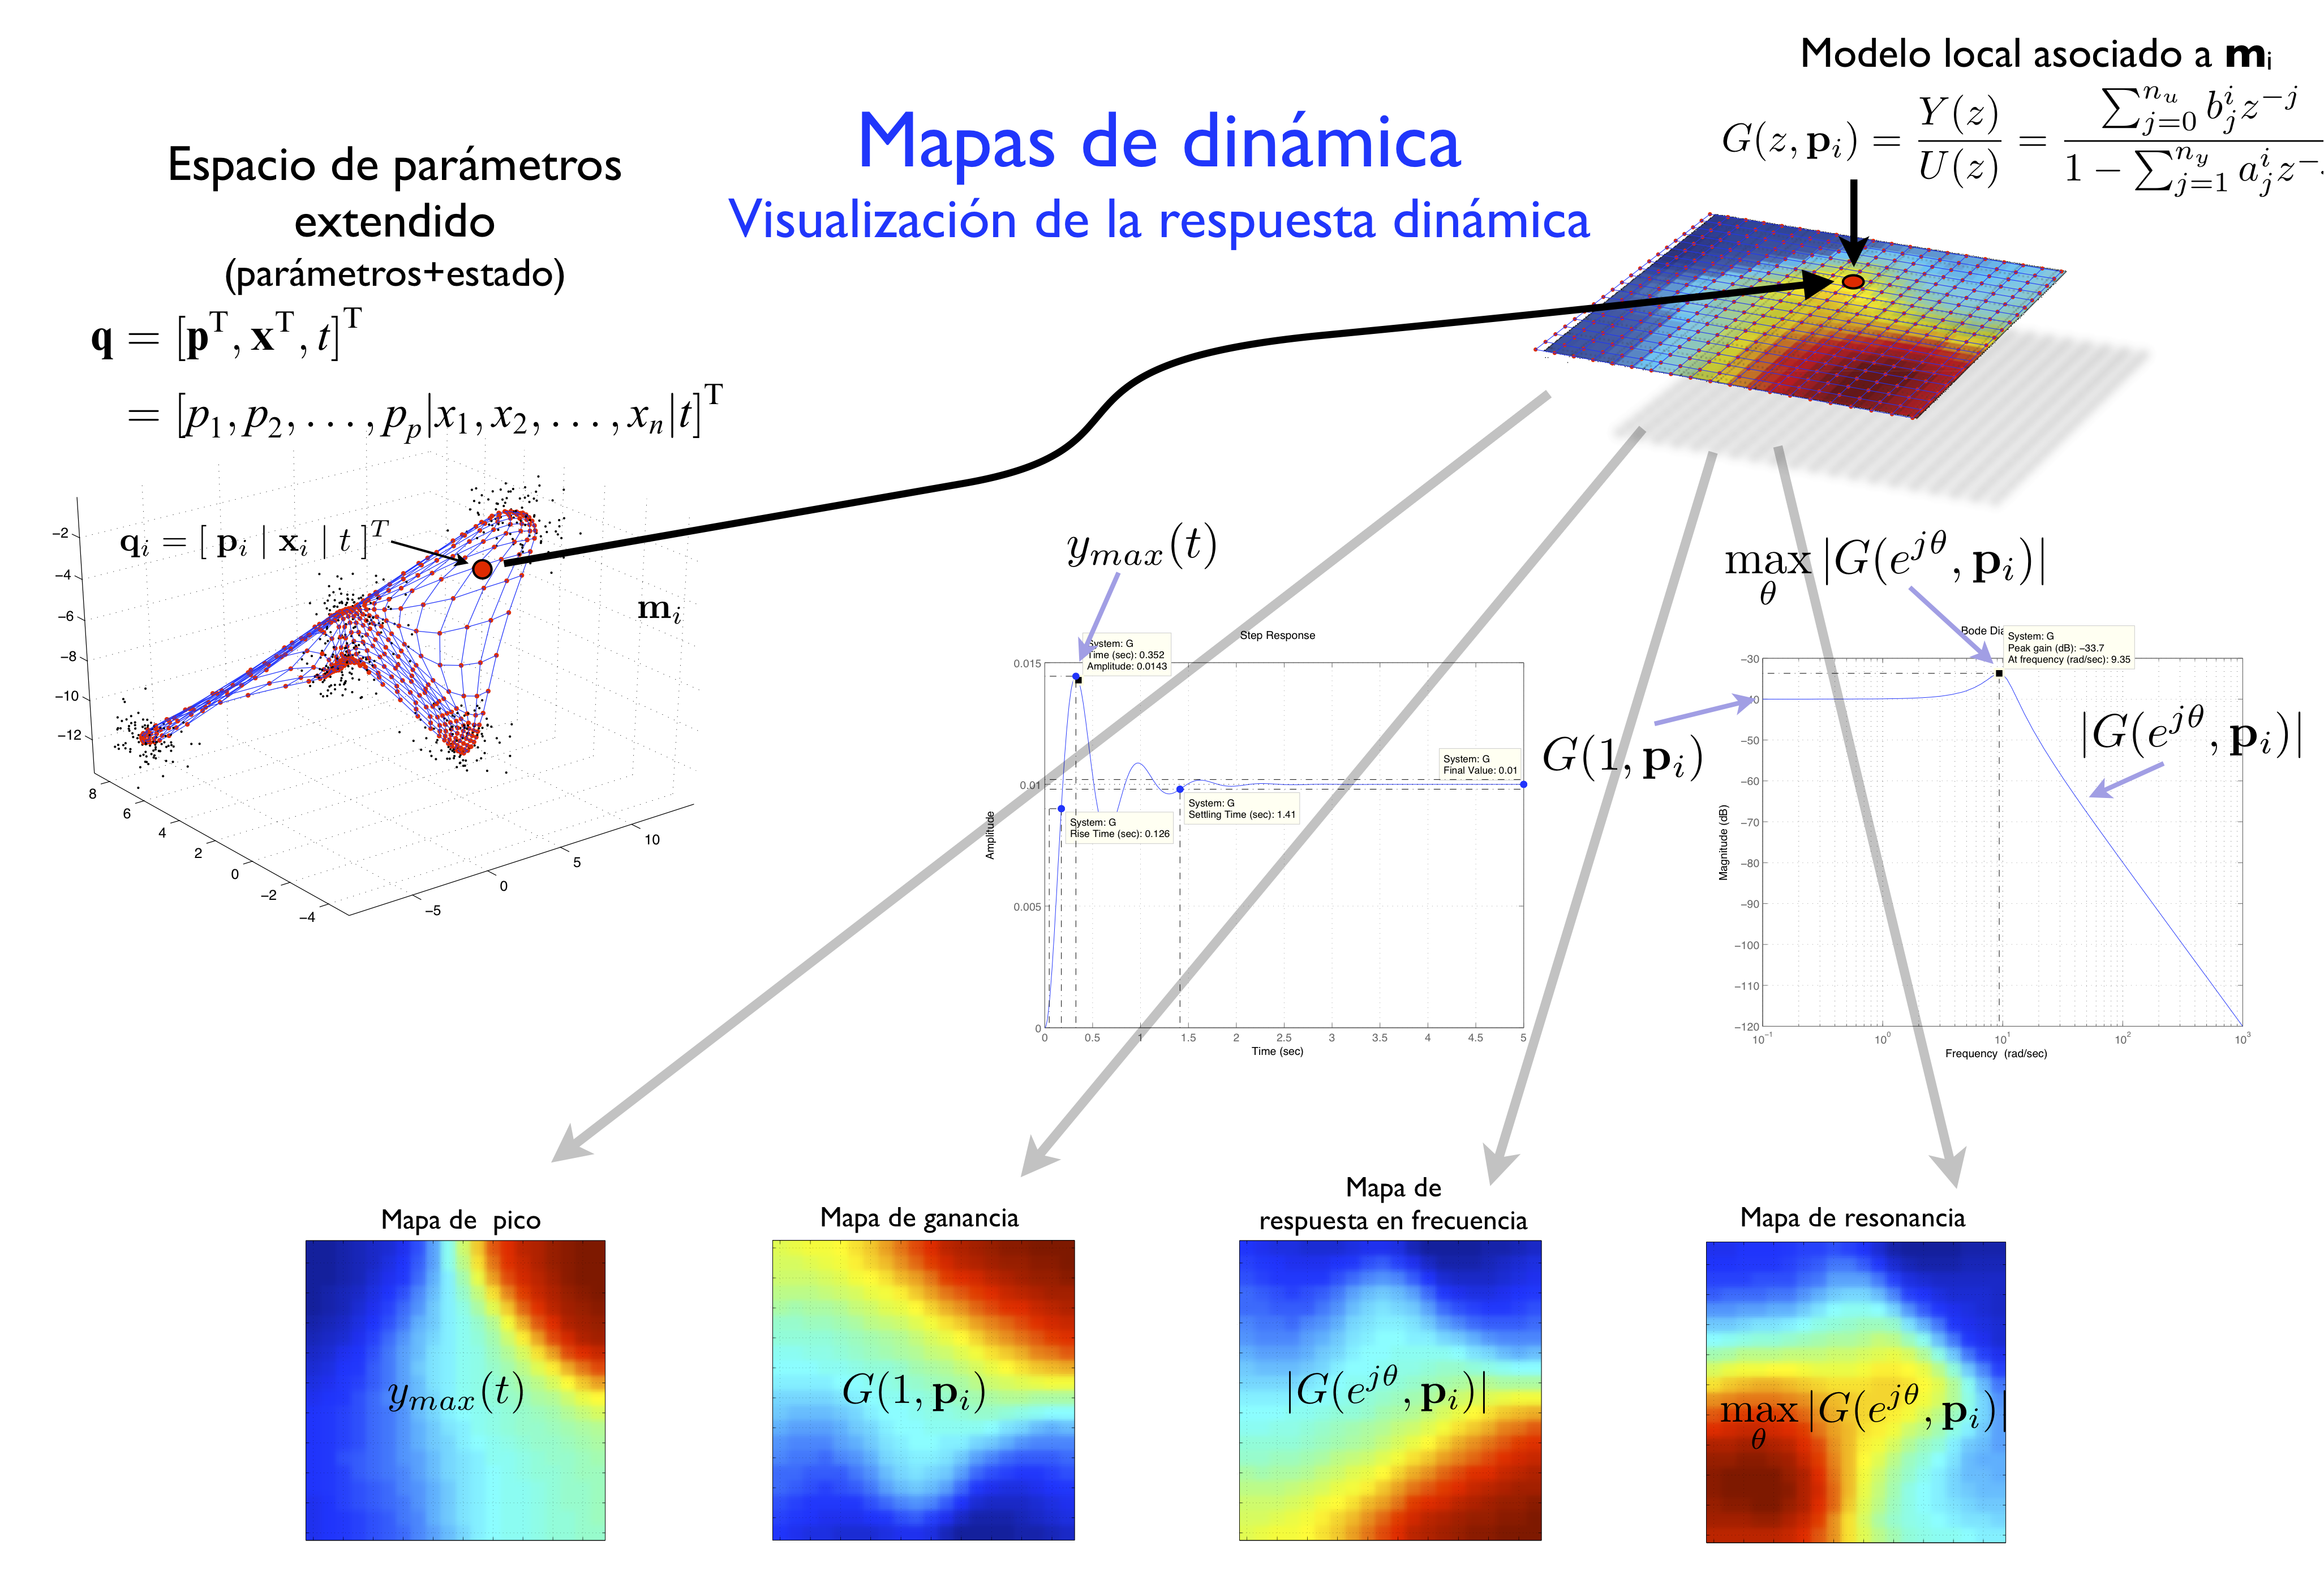 |
Matrix visualization ("small multiples") 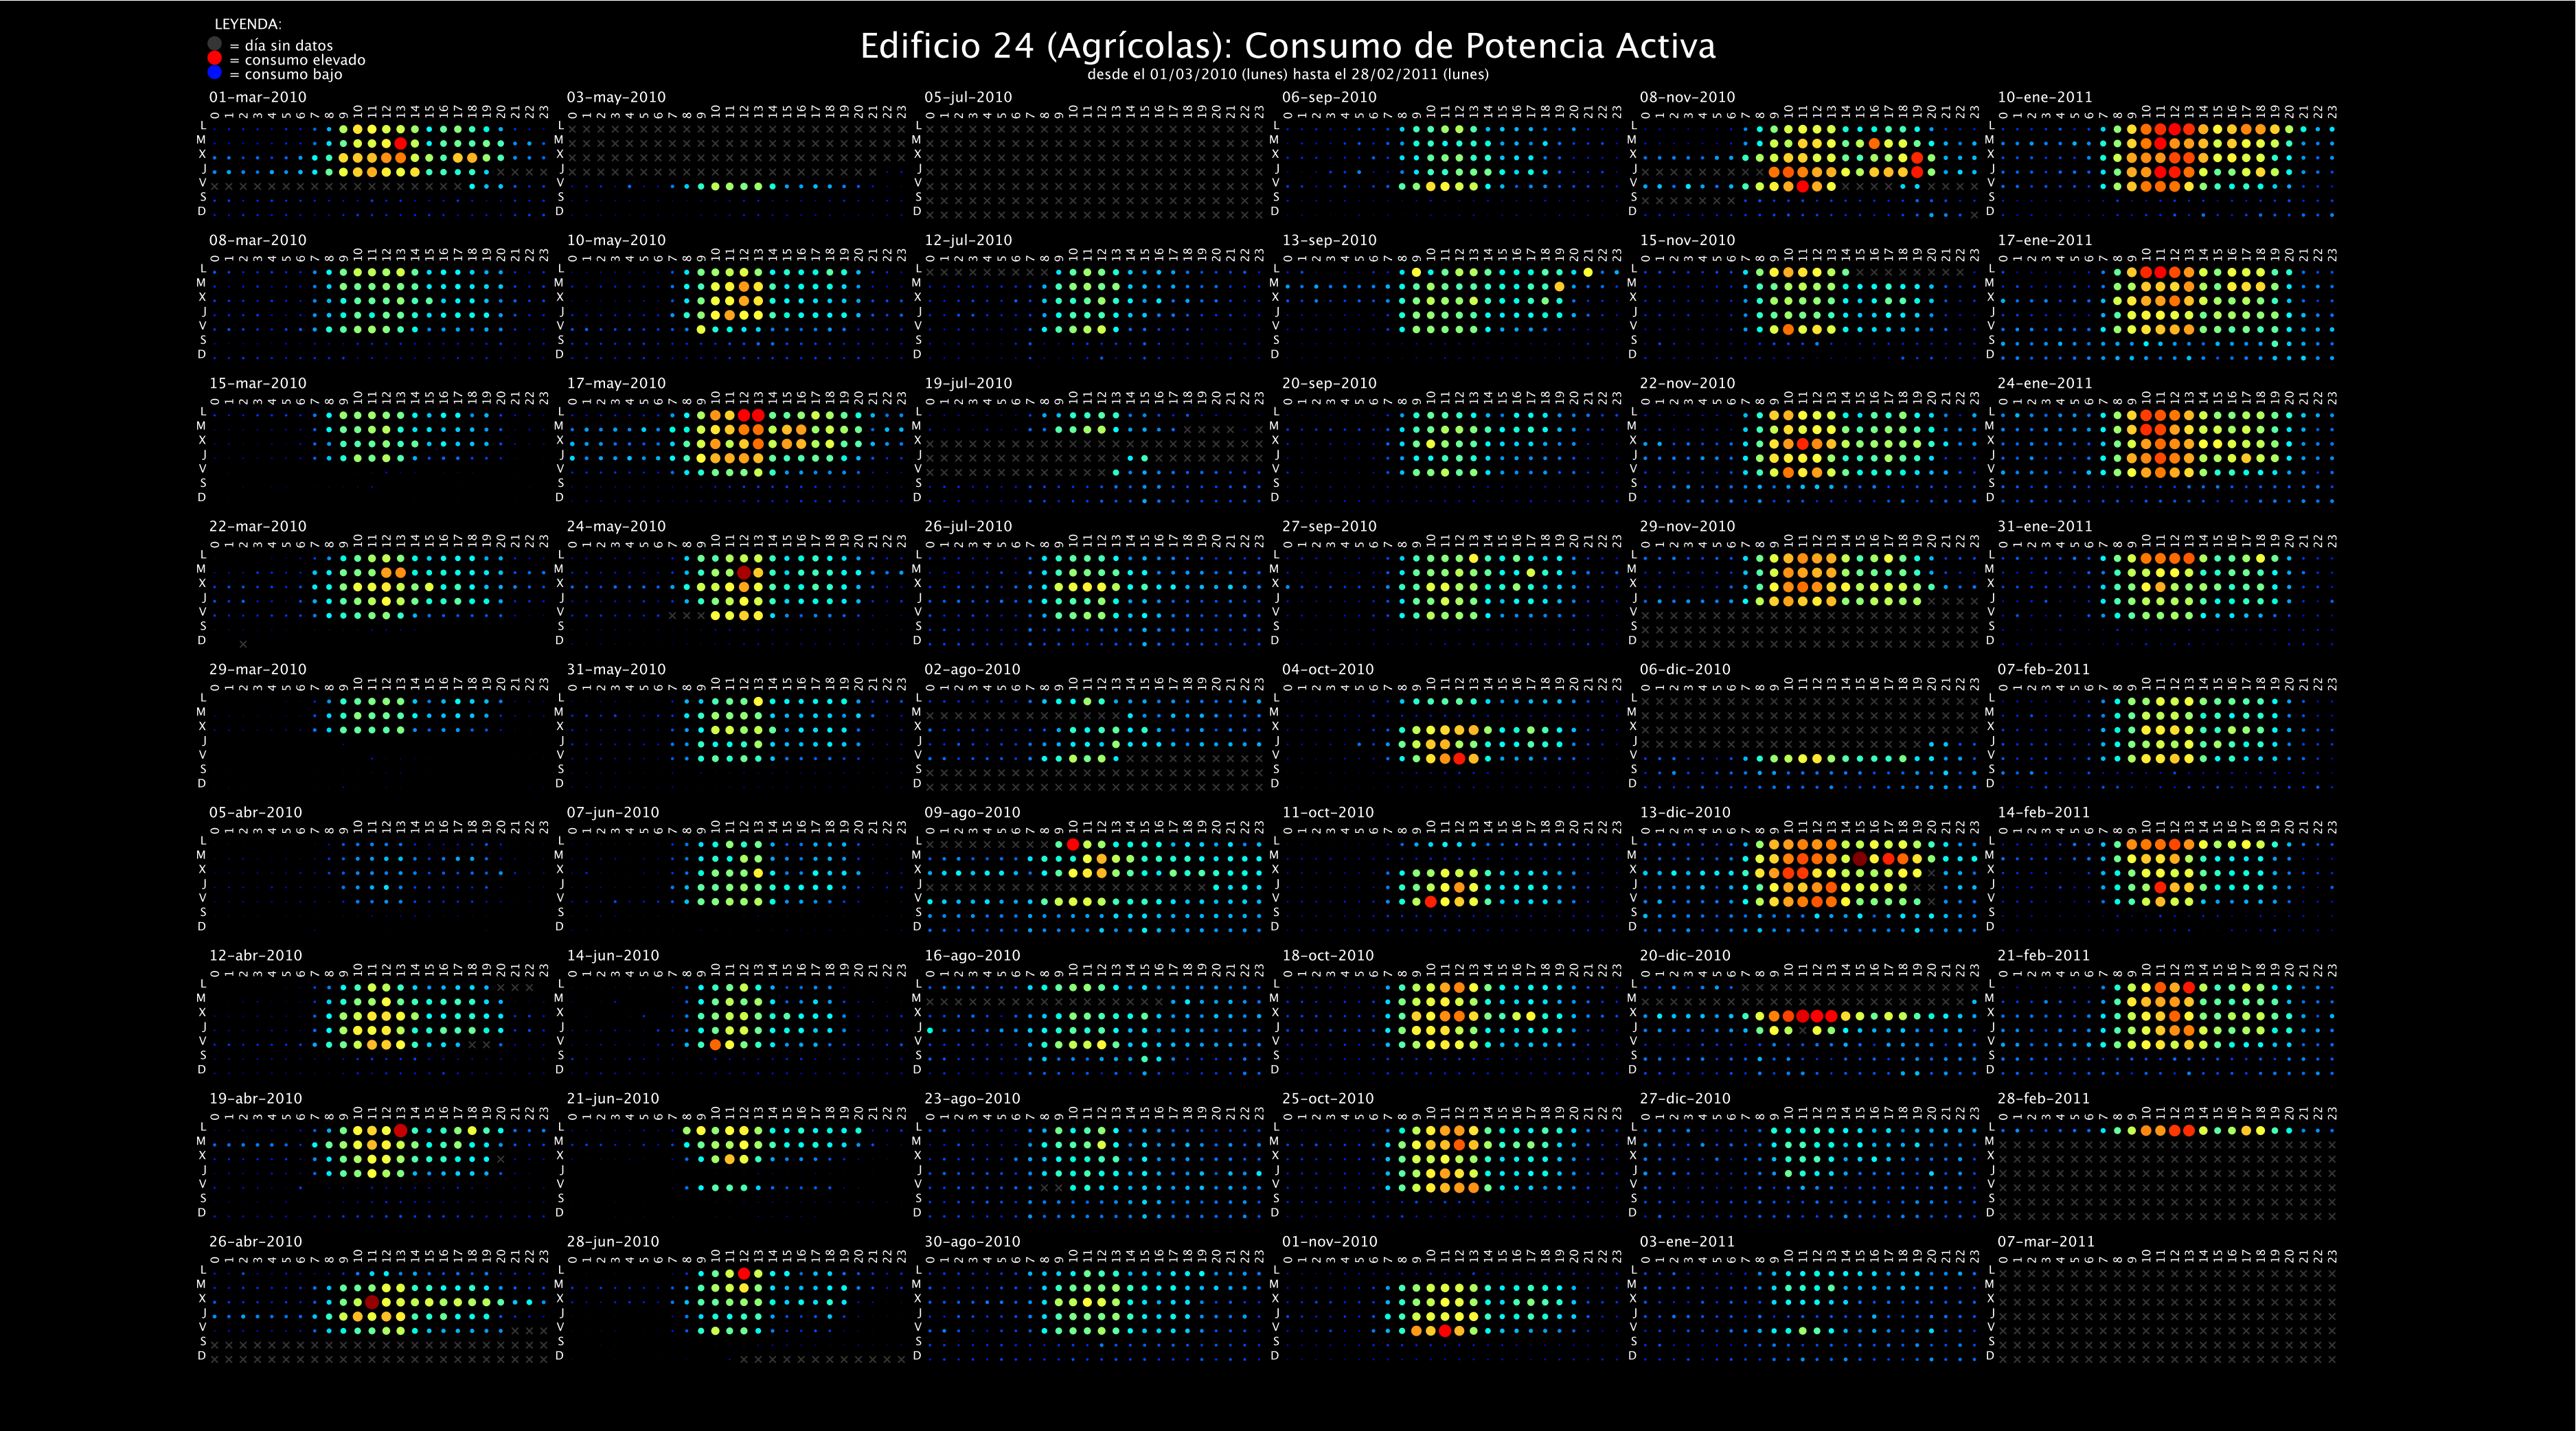 |
Novelty detection of dynamic behavior 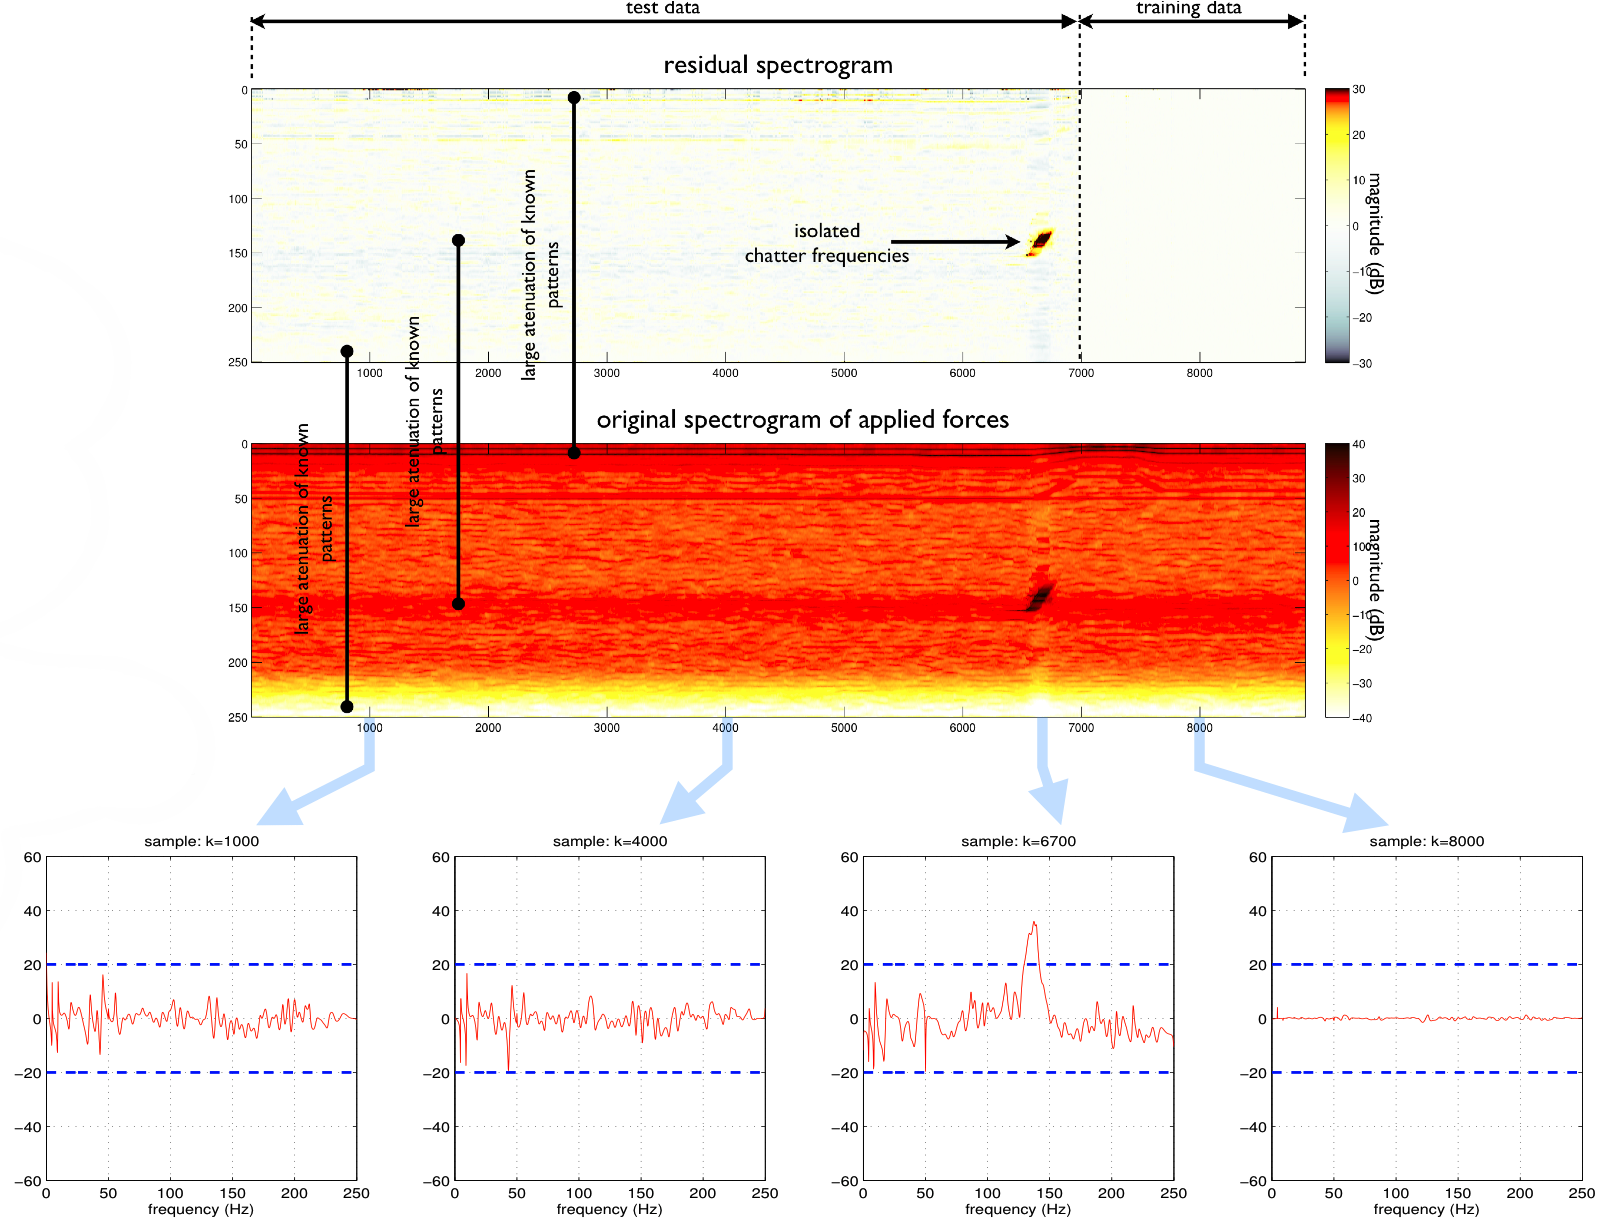
|
|
Self-Organizing Maps (SOM) 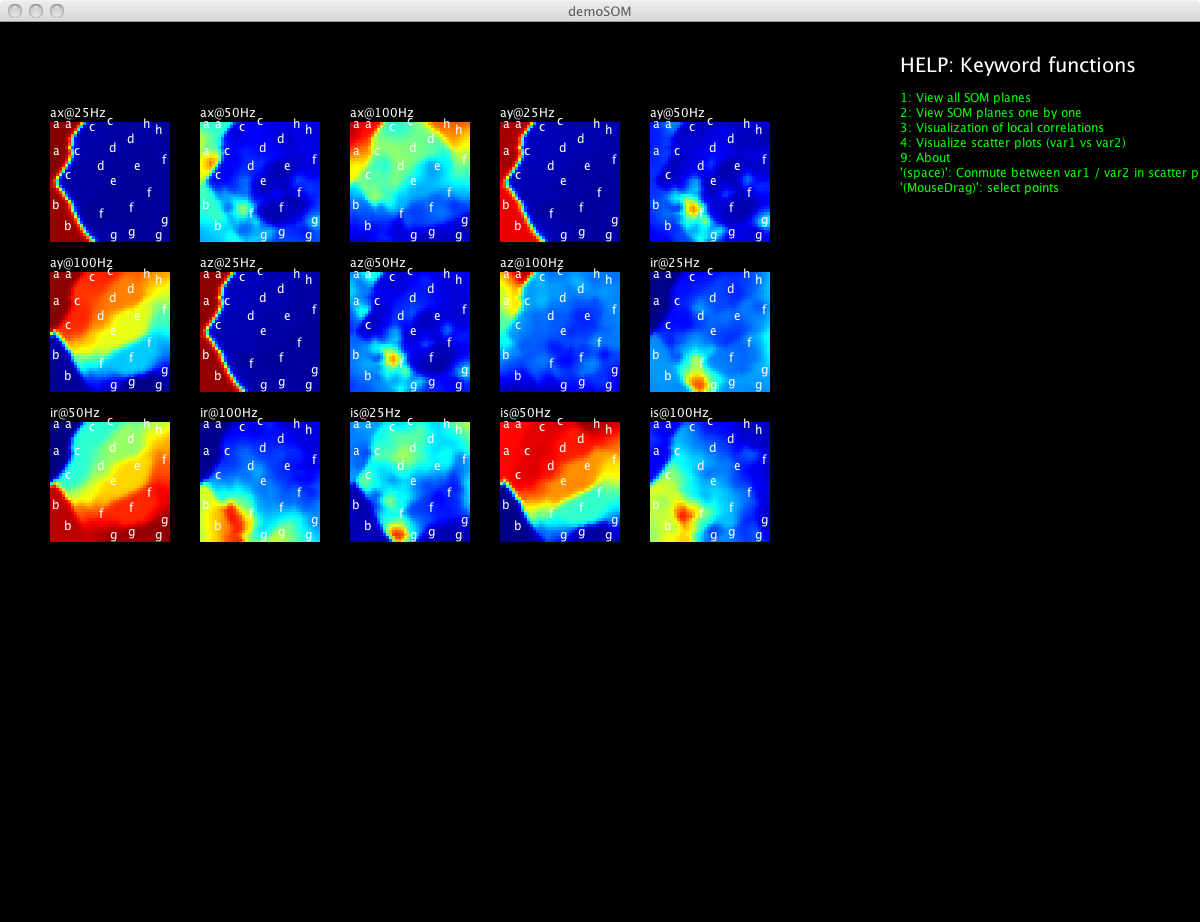 |
State trajectory of a nonlinear system 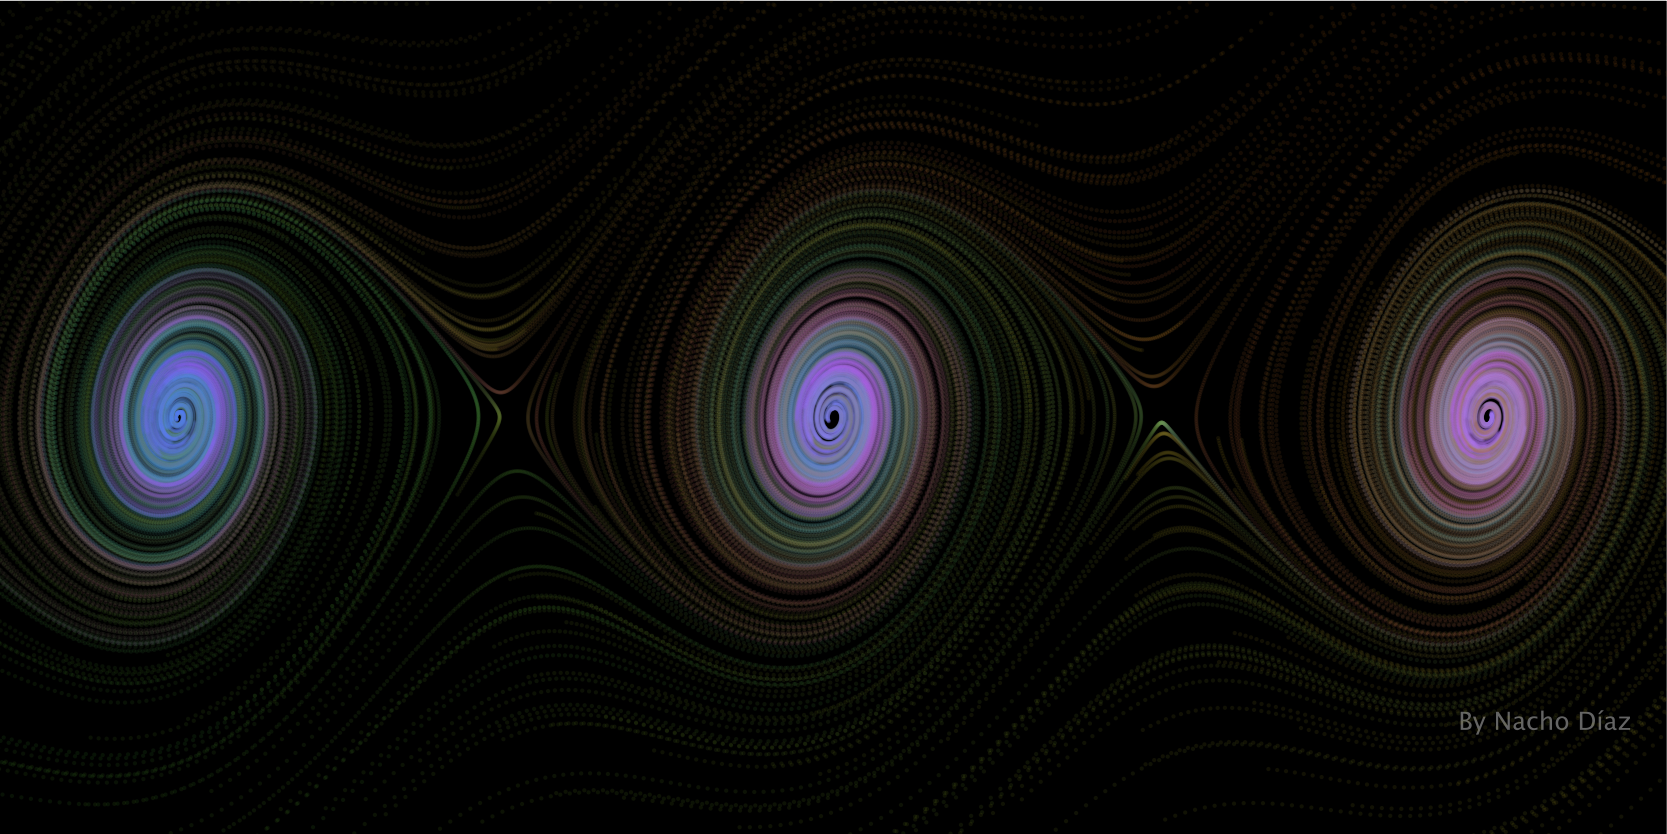 |
Multitouch interface for data visualization 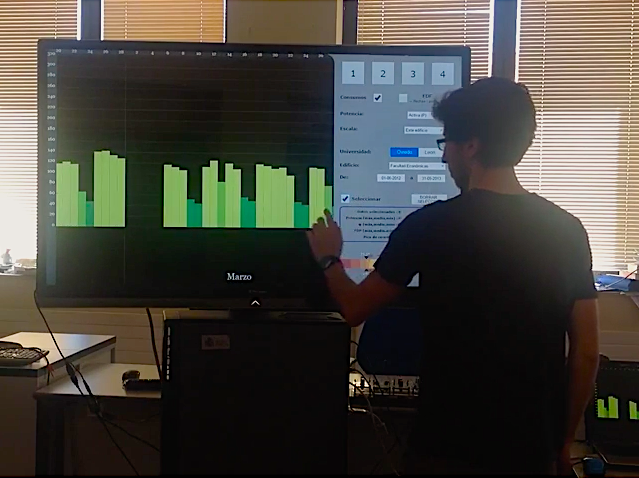 |
|
Interactive data cubes 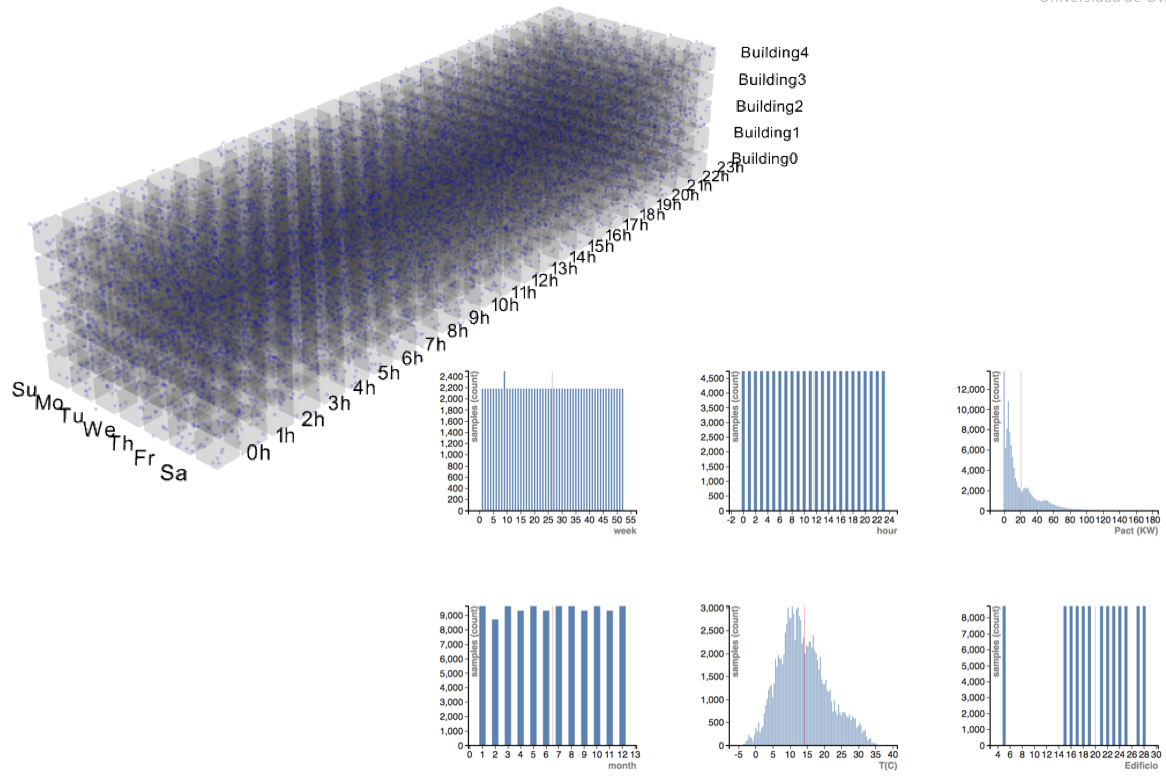 |
Interactive demos
| Online air quality: PM10-Gijón | Online visualization of PM10 particle concentration in Gijón: live data of the last week |
| Spiral web visualization | Basic example of spiral web visualization for several electric power demand parameters from a hospital |
| Interactive web visualization (zoom, pan) | Basic example of interactive web visualization of electric power demand in a hospital |
| Power factor visualization | Example of power factor visualization in a rural area, aggregated by day hour and weekday |
| Electric demand forecasting in UK | Example of electric demand forecasting in july 2013, from training data between may 2011 and may 2012. The example uses an extreme learning machine (ELM) algorithm. |
| iDR visualization: map of vibration states (version using P5js) | Interactive 2D projection of vibrational states, organized by similarities in a set of frequency bands, allowing to filter values, add labels, zoom and pan, etc. |
| iDR visualization: Electic power demand | Interactive 2D map of electric power demand 24-hour patterns, organized by similarities. |
| iDR visualization: Environmental patterns | Visualize an interactive map of electric stations (anonymized), organized by similarities on their emision signatures (6 parameters: SOx, NOx, Dust, etc.) |
| iDR visualization: map of vibration states | Interactive 2D projection of vibrational states, organized by similarities in a set of frequency bands of a rotating machine (induction motor) under mechanical imbalance (eccentric mass) and electrical imbalance (different levels of asymmetric load in one of the phases). |
| Note: in the iDR visualizations, the user can modify the weight of each variable in the computation of the similarity metrics, by dragging the mouse on the corresponding bar in the bottom-right corner. This has the effect of modifying the layout of the displayed elements to accommodate the user-driven changes in the similarity metrics |