en español
Radial visualization
|
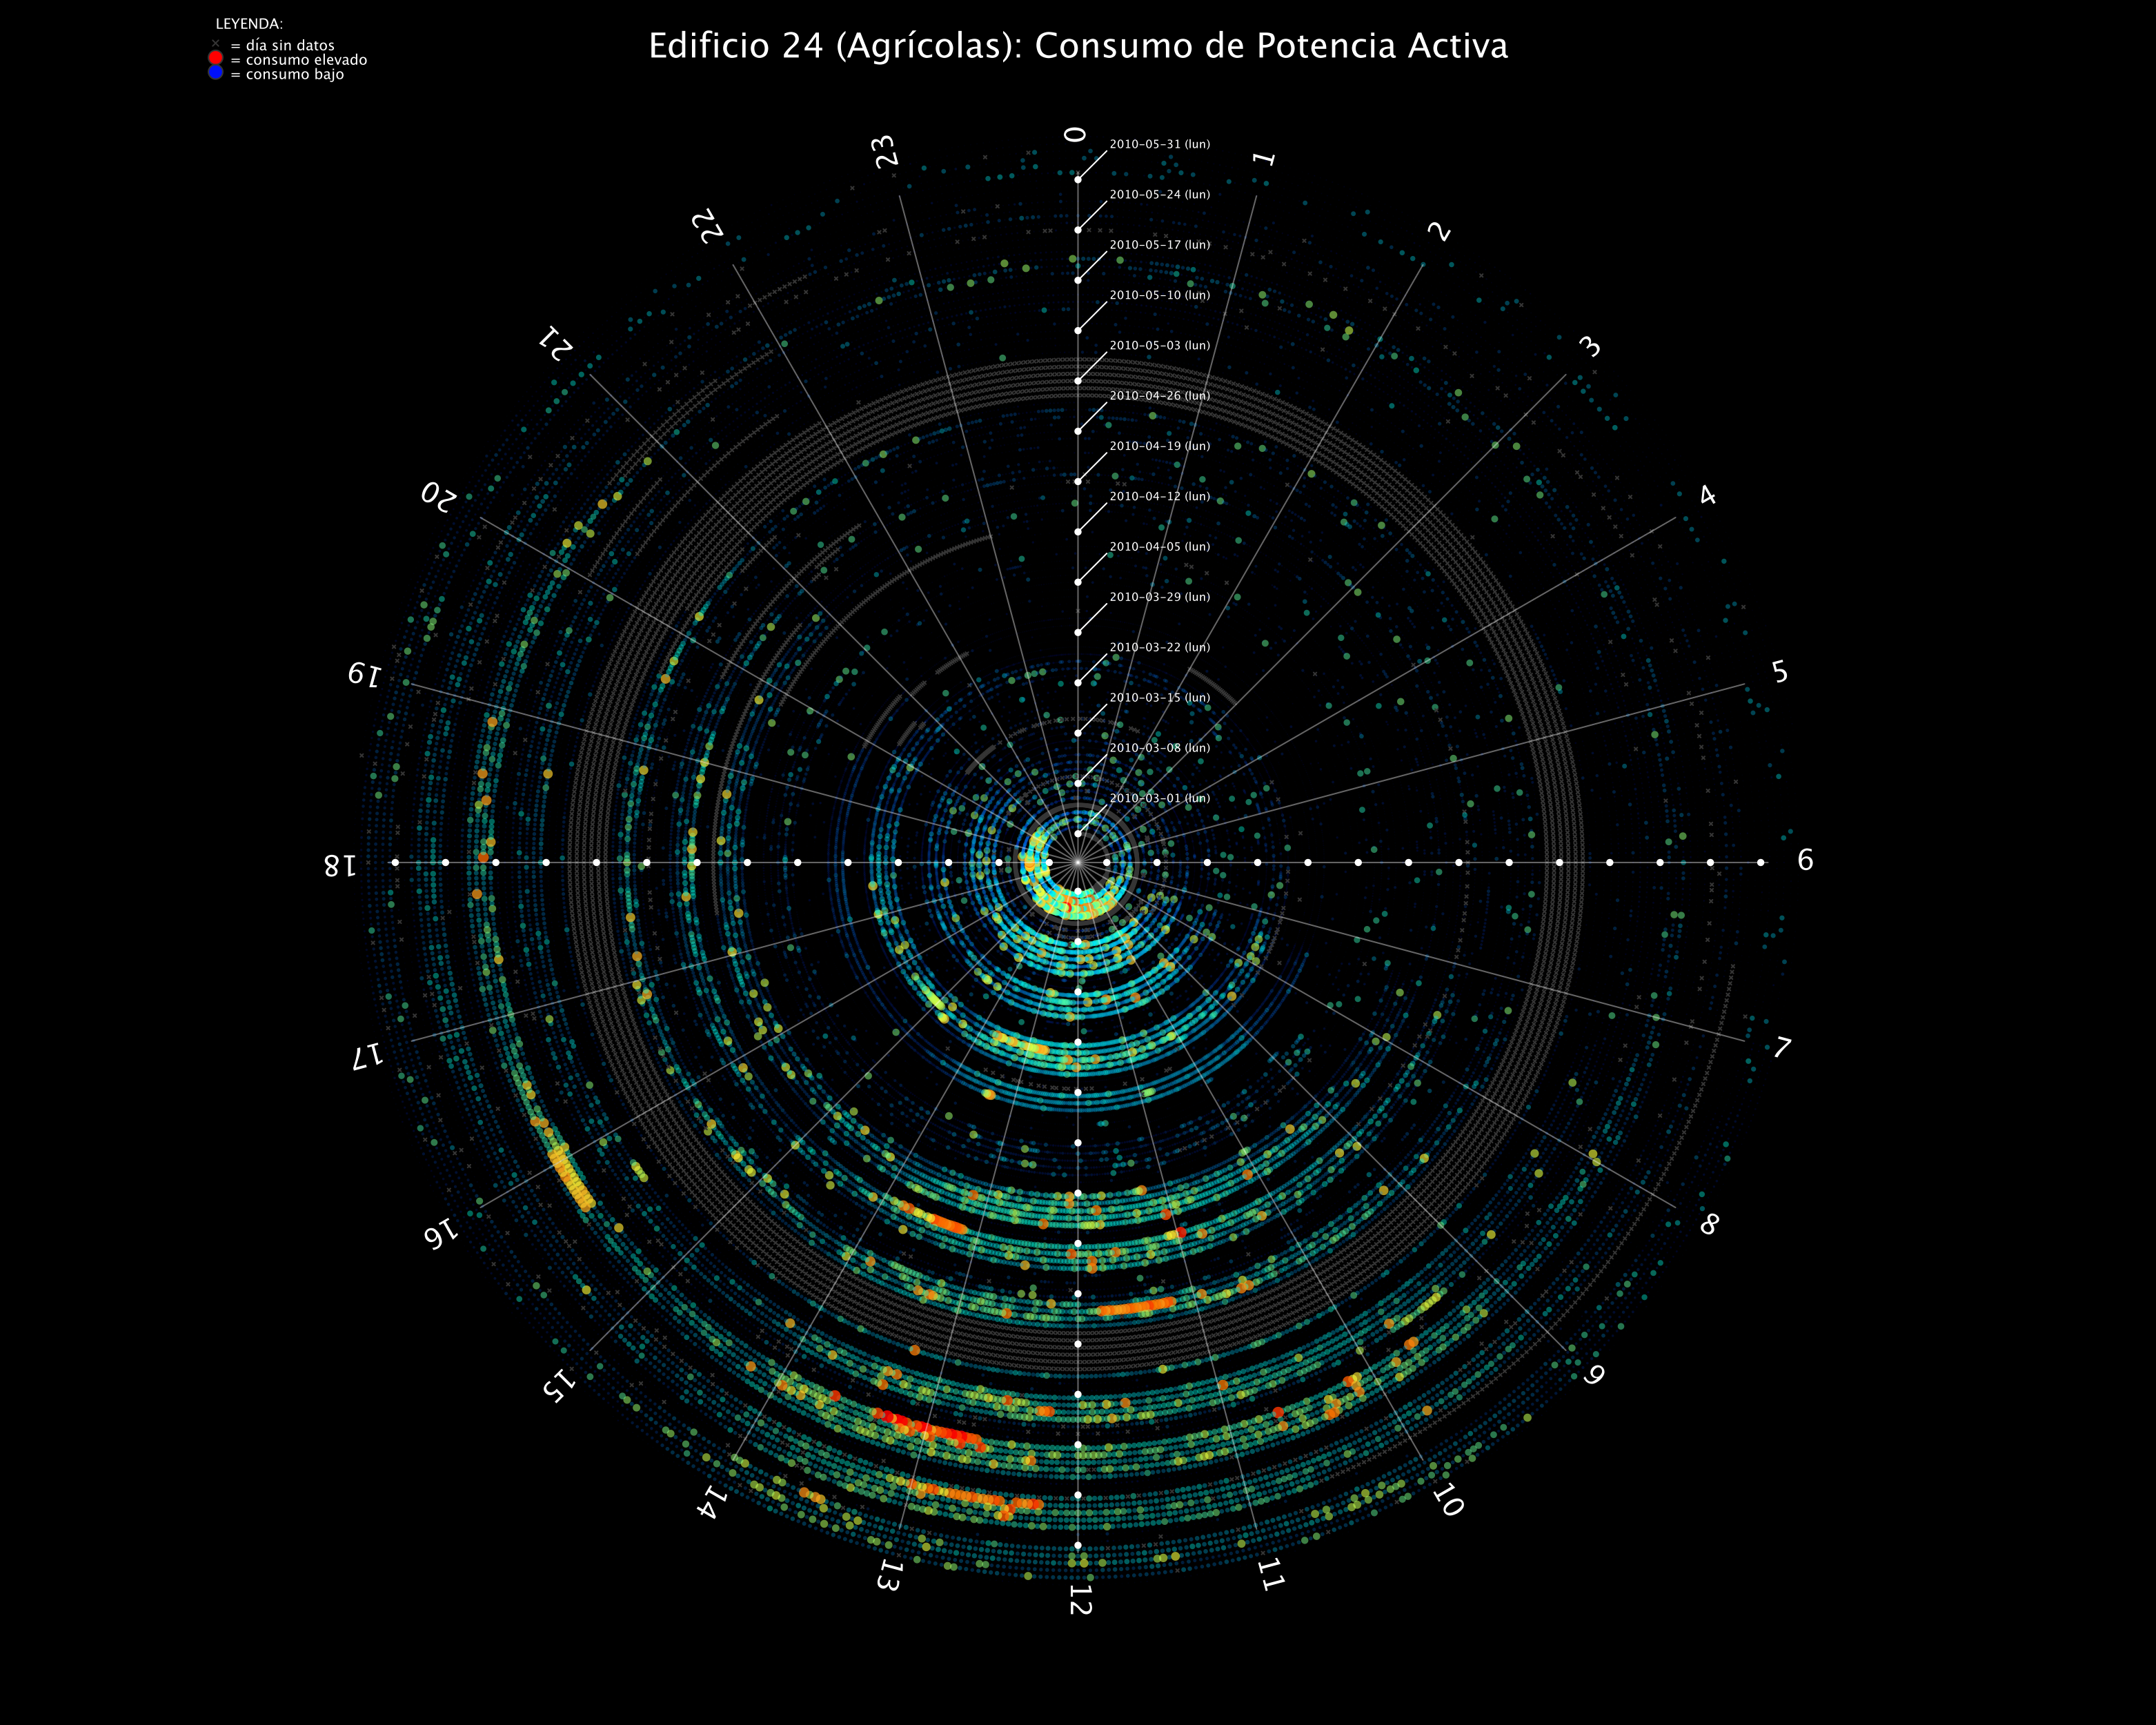
This image, done in Processing (http://processing.org), shows a radial (or spiral) visualization of the electric power demand in a university building. The time flows in a spiral, with a period of one turn per day (each "ring" is a day), and show demand data with a sample period of 2 minutes. The sectors with the 24 hours of the day are shown and the demand is codified using a color scale (blue=small, red=large) as well as using size (large=large demand). The typical patterns in the demand (e.g. peak demand between 12h and 14h) can be clearly seen in this visualization. Also, episodes of singular or abnormal demand are easily spot and identified. |