Data visualization
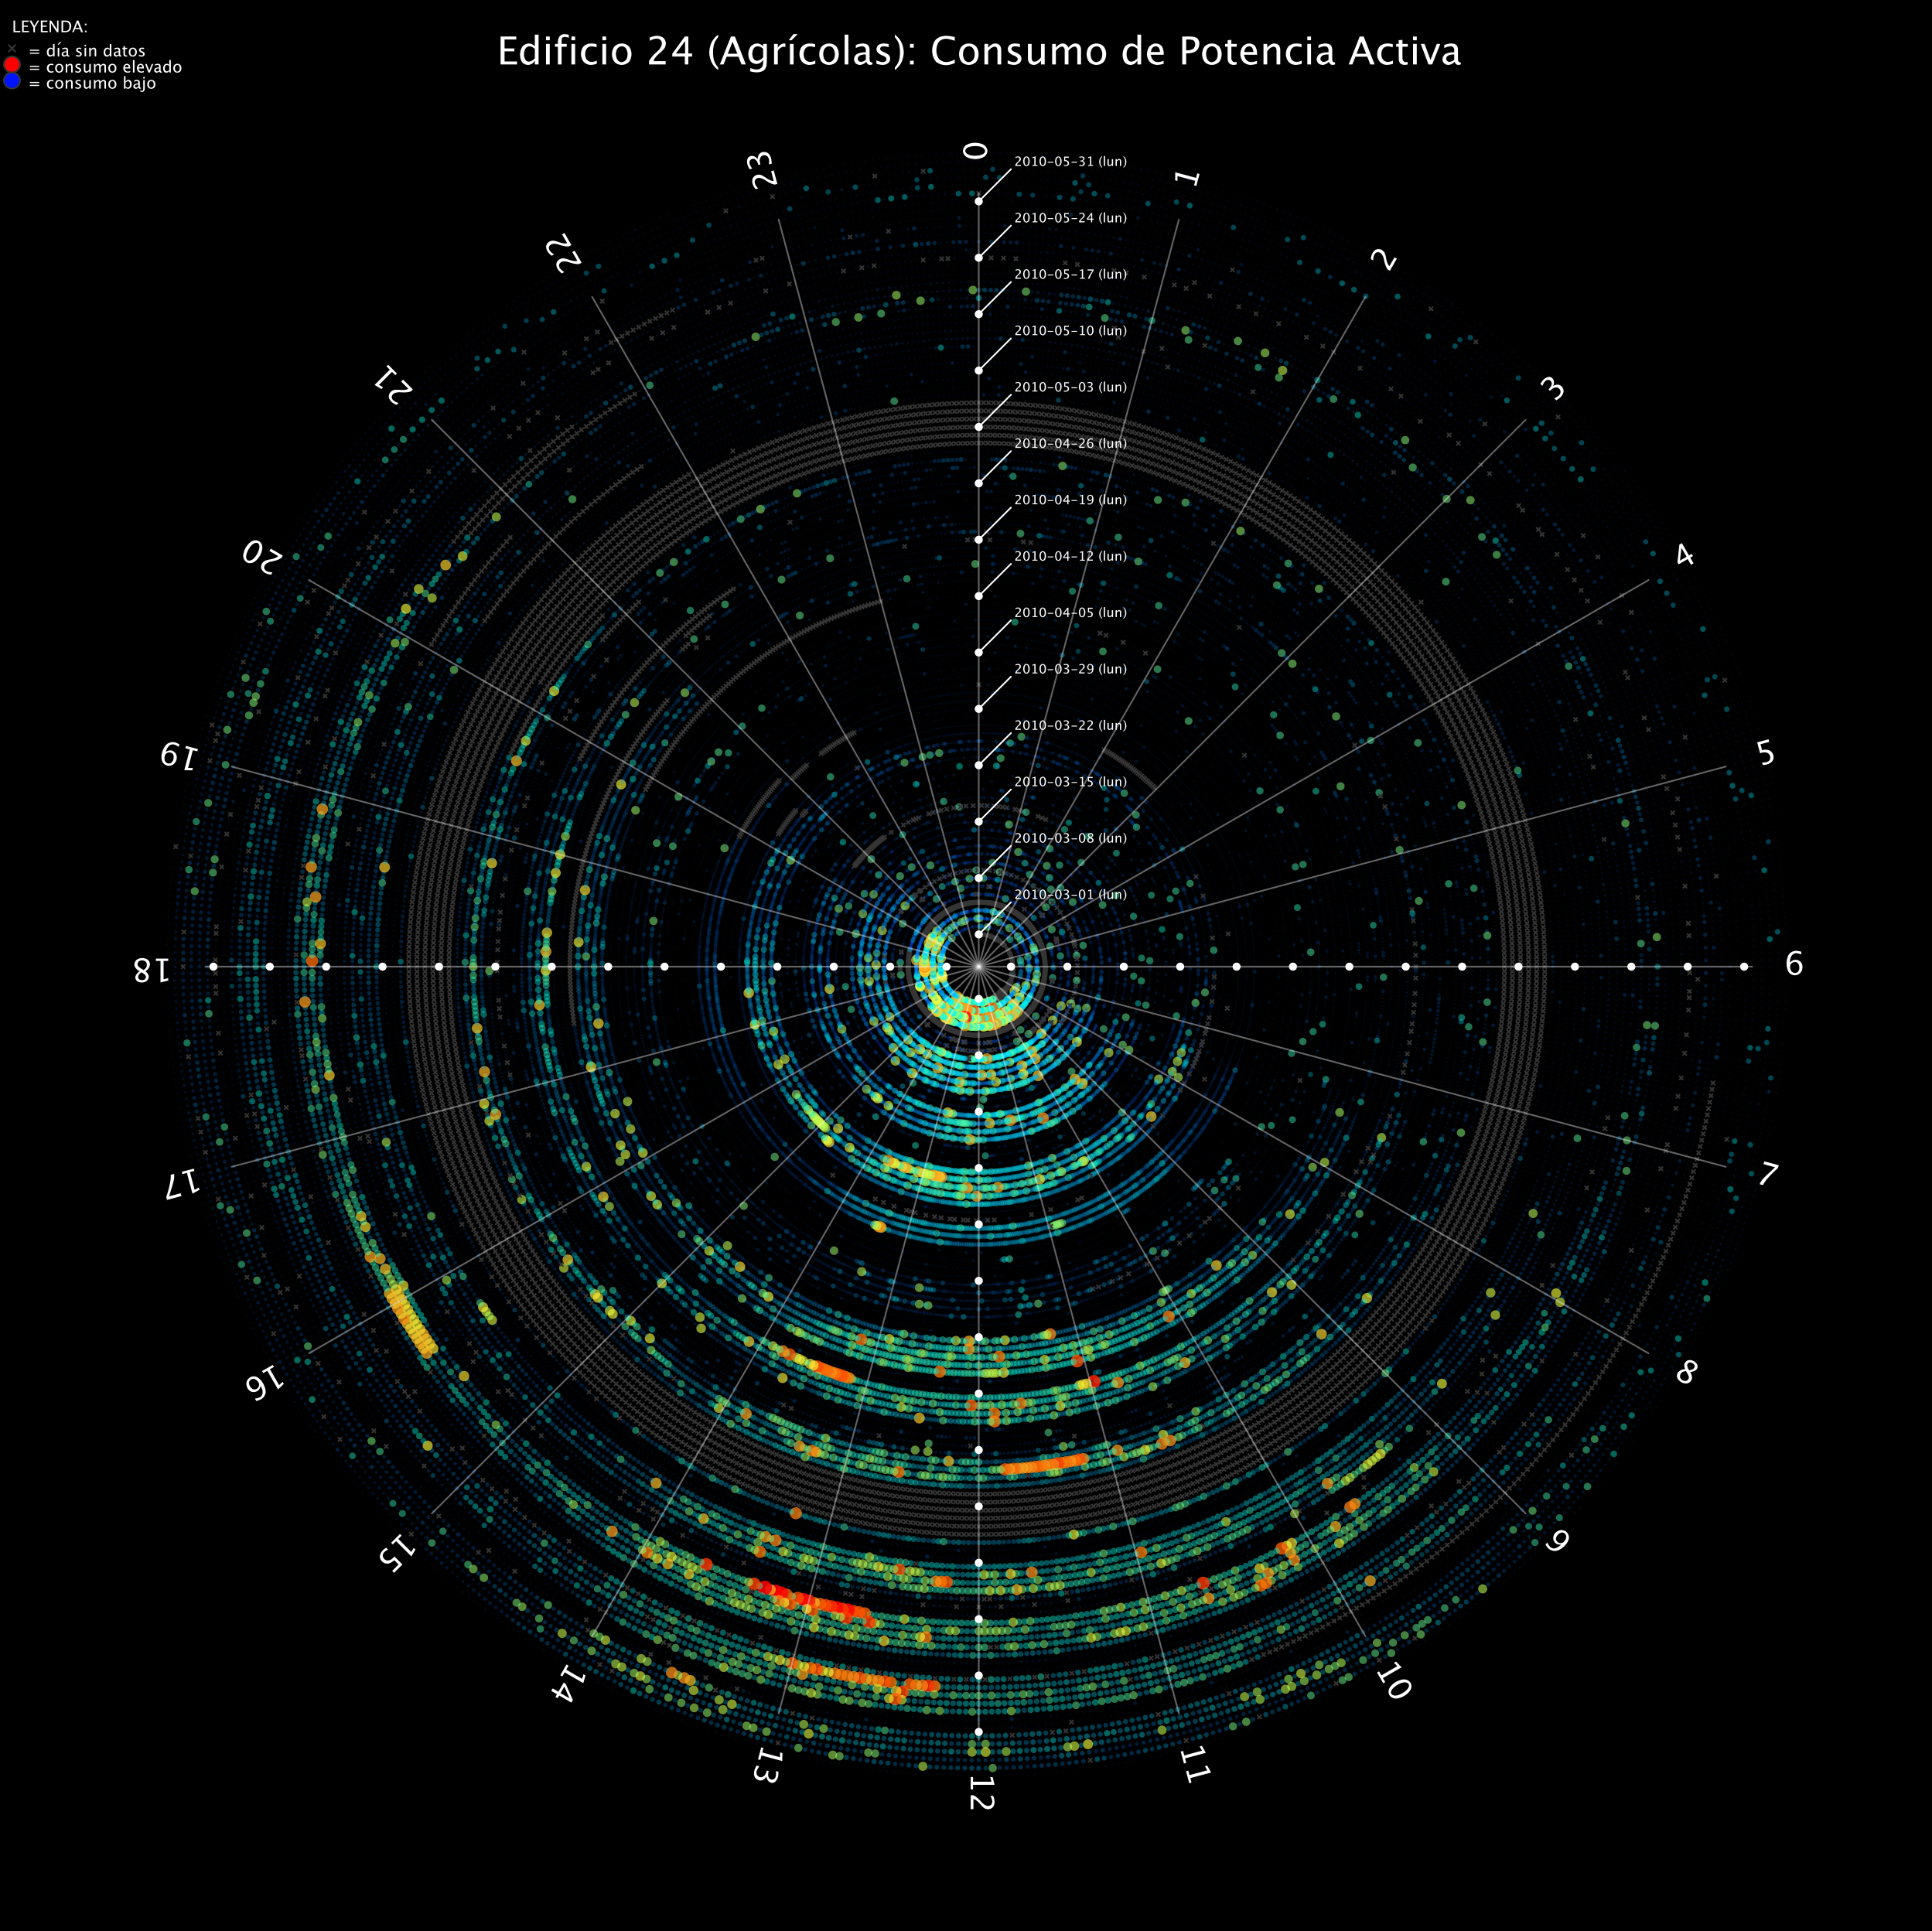
One of my research interests is on specialized visualizations that can help in data understanding, by spatially organizing information according to meaningful criteria, as well as using other visual channels like color, size, etc. Well designed visualizations are very powerful tools for knowledge discovery in data.
Dimensionality reduction
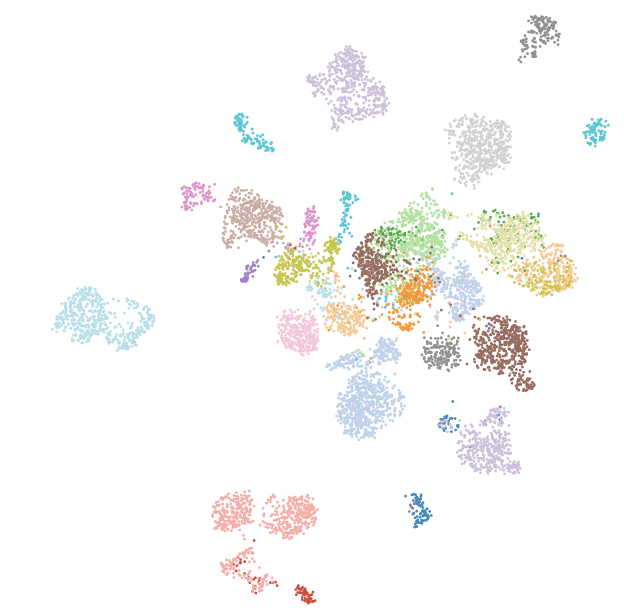
A major topic in my research is dimensionality reduction (DR). DR techniques allow to map high dimensional items into low dimensional latent spaces that capture the main modes of variation in the data in a few factors for data visualization or for problem solving in the latent space. This idea has applications in the analysis of complex high dimensional data like current or vibration signature vectors, gene expression data, timeseries, images, vector fields, etc.
keywords: self-organizing maps (SOM), t-stochastic neighbor embedding (t-SNE), universal manifold approximation projection UMAP, deep autoencoders (AE, VAE, beta-VAE, etc.)
Dynamical systems
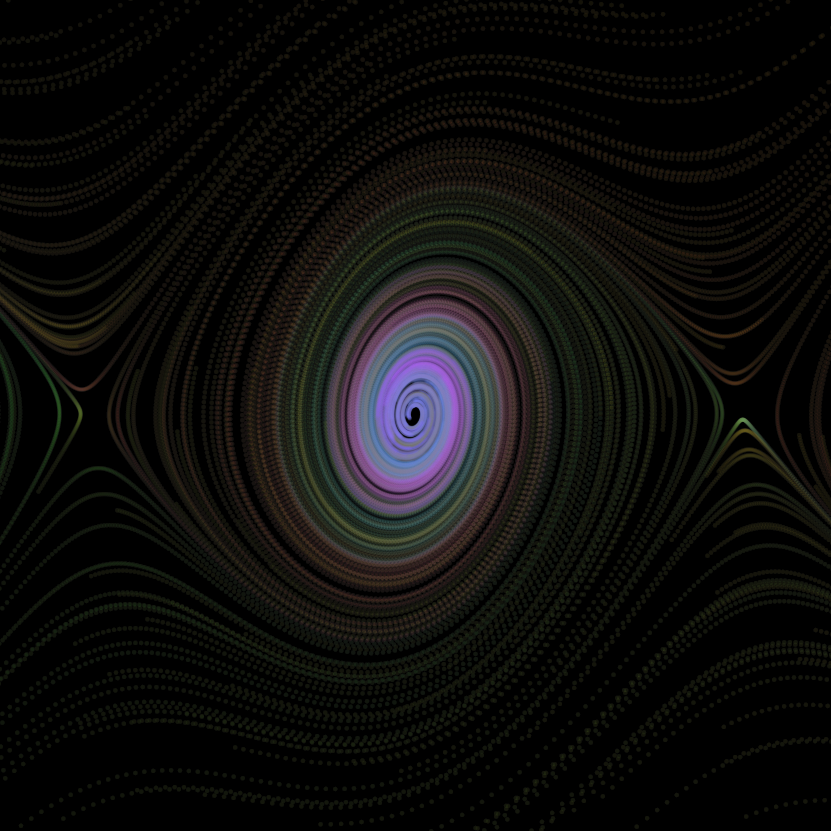
I also research on modeling dynamical systems out from data using different approaches like convolutional neural networks, recurrent networks or nonlinear regression techniques. Models obtained by these methods can serve as digital twins that can be used to monitor the process, detect anomalies, or discover useful knowledge for process optimization
keywords: echo-state networks, deep CNN architectures, sparse nonlinear regression in dynamical systems
Morphing projections
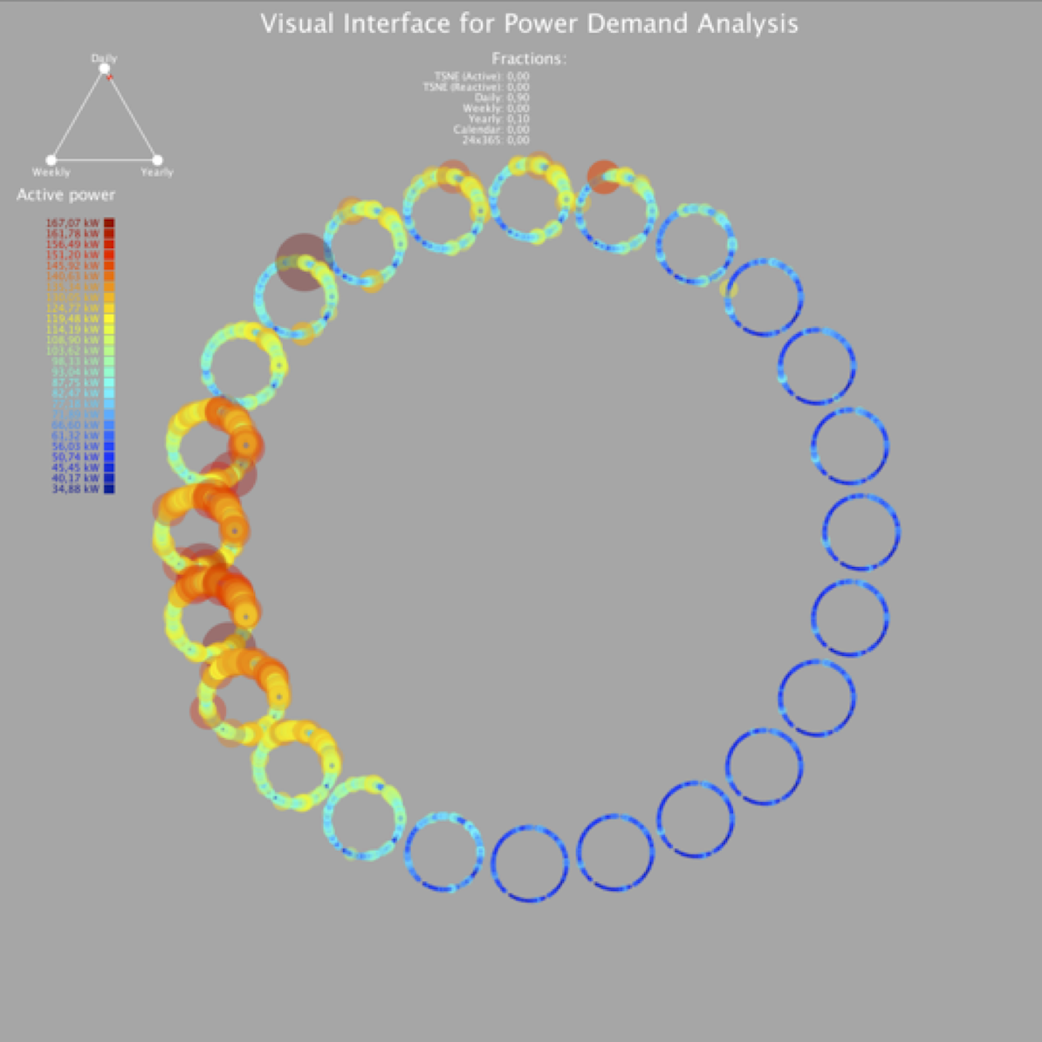
Morphing Projections is a powerful interaction technique that we developed (Diaz et al, 2021) for engineering and biomedical data analytics. It is based on blending meaningful views, allowing to transition among different but complementary representations of data and knowledge. The ability to combine information from different domains allows the user to discover relevant relationships or generate new hypotheses to be investigated by other means.
Interactive dimensionality reduction
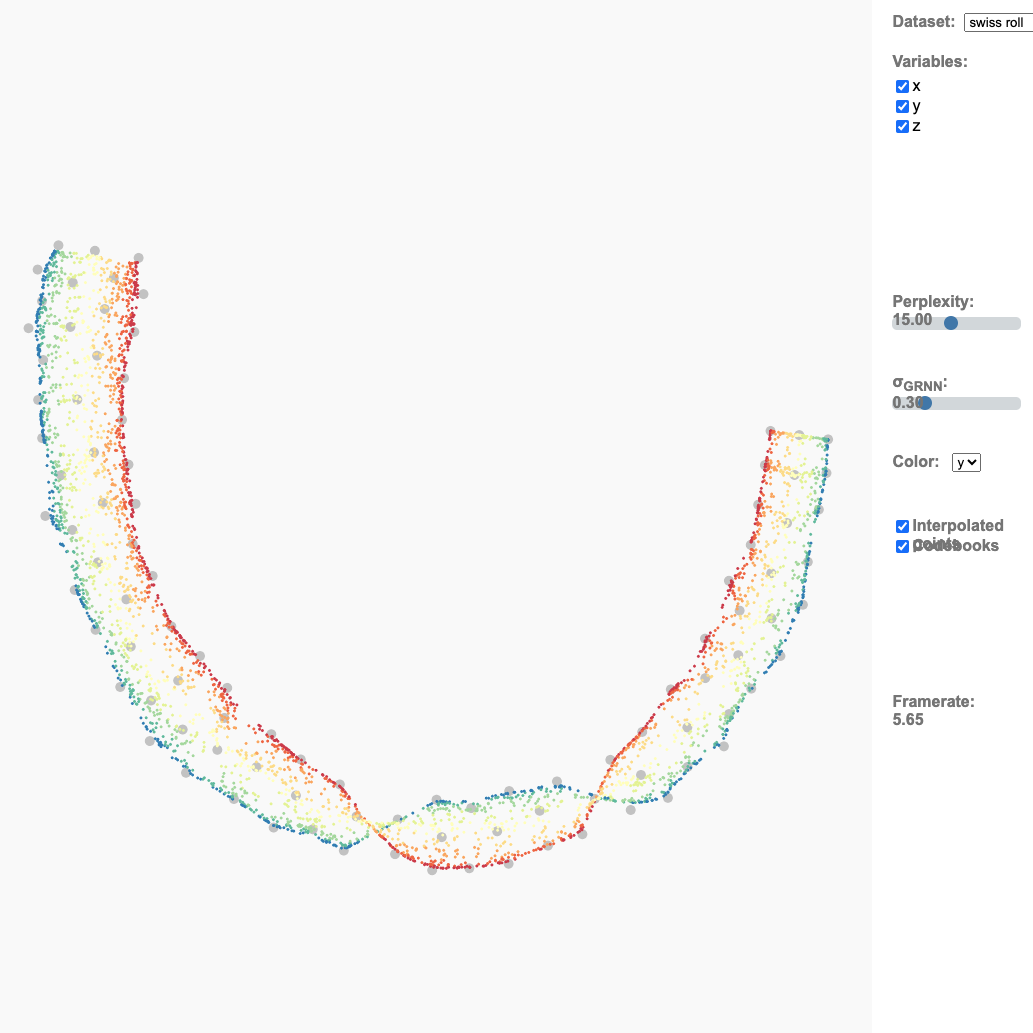
Allowing the user to take complete control of a DR algorithm during convergence and visualize the intermediate projections, results in interactive dimensionality reduction, iDR (Diaz et al., 2014) (Endert et al., 2017). Using DR algorithms based on iterative approximation, such as the t-SNE (t-stochastic neighbor embedding), the visualization of intermediate projections produces a smoothly varying layout — an animated transition— that allows the user to track changes in the formulation of the problem, such as variations in the input data, or user modifications in the weights of the input attributes [see working demo].
Interactive data cubes
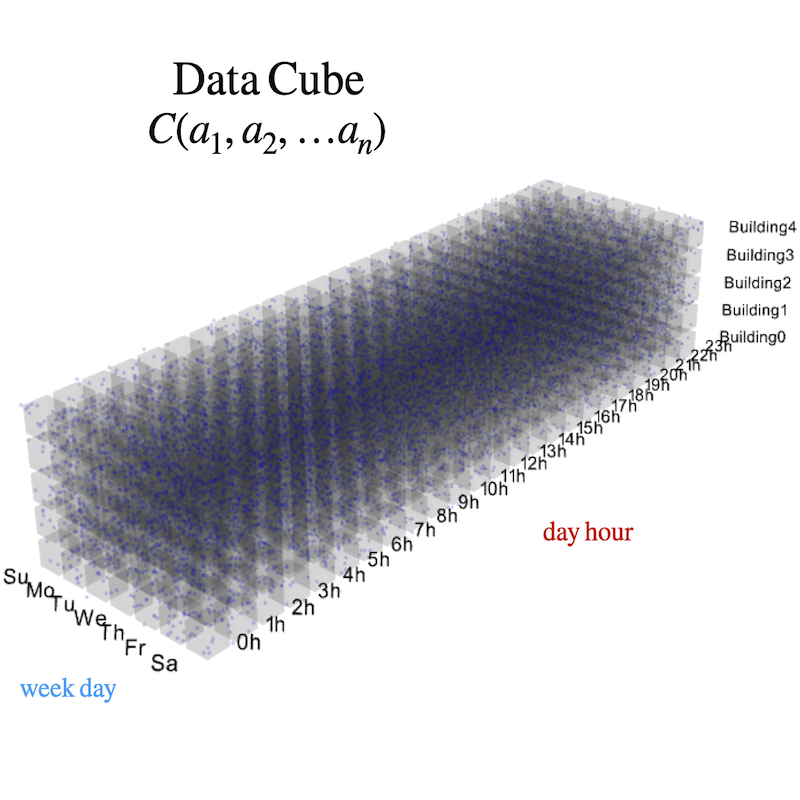
Interactive data cubes (iHistograms) allow the user to analyze datasets with several attributes (columns), organizing samples (rows) internally as a hypercube, where each side is an attribute and each cell contains samples with a combination of attribute values. By defining filters for a set of attributes, the histogram of the samples, conditioned to the filtering operation, is shown in real time, allowing the user to explore different scenarios interactively. Aggregated values (e.g. mean, sum, max, etc.) can also be recomputed and represented allowing the generation "on the fly" of statistics like "average demand by buildings on saturdays", through drag and drop gestures. [see working demo]
